

TerraScan User Guide
Display mode
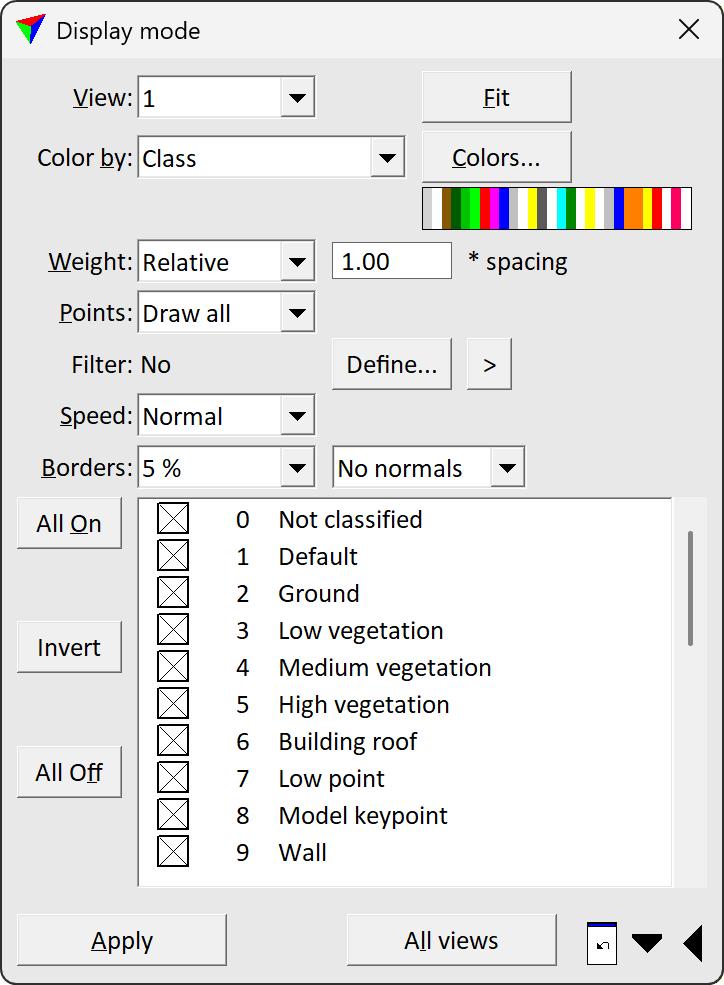
Display mode command opens the Display mode dialog which contents settings for controlling the display of points loaded in TerraScan. See also Point display category of TerraScan Settings for setting default values and the general drawing method for points.
To set up the display of points:
1. Select Display mode command from the View pulldown menu.
This opens the Display mode dialog.
2. Select a View for which you want to modify the point display.
3. Define display settings.
4. Click Apply in order to update the display settings to the selected view.
SETTING |
EFFECT |
|
|---|---|---|
View for which display settings are modified and applied. |
||
Fit the display in the selected View to the extend of the visible points. |
||
Attribute of points used for coloring: |
||
|
•Echo |
•Line •Time |
|
Coloring options are only available for display if the corresponding attribute is assigned to the loaded points. |
||
Opens a specific dialog depending on the selected coloring attribute. See more information for each coloring attribute below. |
||
The attribute field to use in visualization. Enables use of Extra attributes. |
||
Determines the point size: •By class - class-specific size settings. See Define Classes command for information about class definitions. •0 ... 7 - eight standard line weights of the CAD file. •Relative - point size varies depending on the zoom level. The factor next to the Weight field determines the point size based on the point-to-point spacing. •Smooth fill - smoothed point display effect. Good for viewing surfaces with intensity or point color display. The factor next to the Weight field determines the amount of smoothing based on the point-to-point spacing. |
||
Visibility of points: •Draw all - all points. •Active - active points only, hiding reference points. •Reference - reference points only, hiding active points. •Displayset - points of a defined displayset. This requires that a displayset has been defined, e.g., using the Add Points To Displayset tool. |
||
Define filter to show certain points only in the visualizations. |
||
Activate a filter define shortcut to show a single line only. Select the desired line to show pointing the desired trajectory and placing a data click. |
||
Method of drawing points: •Fast - sparse points - amount of displayed points depends on the zoom factor. If you zoom out, only a subset of points is drawn. This is the recommended setting for displaying a larger amount of points. •Normal - more points are drawn. The software decides based on the density of the point cloud. In sparse data sets, this already draws all points. •Slow - all points - all points are drawn at every zoom level. This is recommend, for example, for displaying sparse points spread over a larger area. It may slow down the display speed for a large amount of points. |
||
The setting enhances the depth perception of the point cloud by drawing black borders or a shadow around point groups that are in front of other points from the viewer's perspective. If set to a value > 0, the display of the point cloud includes the given percentage of black space on the screen. The larger the value, the more black borders are drawn and the more detailed the point cloud appears. 10% is a good value for many data sets and viewing directions. The maximum value is 50. The setting enforces the Raster display method. See also Point display category of TerraScan Settings. •None - no enhancement. •Occlusion - draw shadows around points. •<percentage> - draw given amount of black borders. |
|
|
If on, normal vectors are used for drawing points. The brightness of points is determined by normal direction where 'foreside' points are drawn brighter and 'backside' points are drawn darker. The setting works only for points of planar dimension and in combination with constant coloring types for points, such as Color by = Class, Dimension, Echo, Line, etc. This is active only if normal vectors are computed or read in from NormalX, NormalY and NormalZ extra attributes for points. •No normals - no effect. •Use normals - uses computed or read in normals. This is preferred over To viewer. •To viewer - flips normals towards viewer. Use this if normals are computed without scanner position information. |
|
|
Switch the visibility of single classes on or off by clicking in the field next to the class name. The list contains the active classes of TerraScan. |
||
Switch on the visibility of all classes. |
||
Invert the visibility of classes. |
||
Switch off the visibility of all classes. |
||
Apply current settings to the selected View. |
||
Apply current settings to all views. |
||
Undo the last change to display settings. This sets back the display to the previous state. The undo button works only for one last modification of display settings. |
||
Extend the length and/or width of the Display mode dialog. If the dialog is extended to a wide dialog, the class numbers are displayed in addition to the class names. |
||


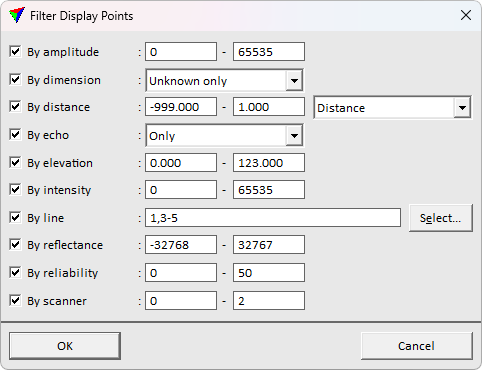
Filter limits the display to show only points fulfilling the filter criteria. A single filter can filter points by multiple different point attributes.
Color by Active-reference setting displays active points with one color, and reference points with another color. This is useful for inspecting differences between the active and reference data.
Color by Amplitude setting displays points according to the Riegl Extra Byte attribute Amplitude.

Color by Channel setting displays the points according to their channel attribute. To change the colors for channels, click the Colors button next to the Color by field. This opens the Channel colors dialog. To choose a color for a channel, click a color. This opens the standard dialog for color selection.
Color by Class setting displays the points according to their class attribute. To change the colors for classes, click the Colors button next to the Color by field. This opens the Point classes dialog which is described in detail for the Define Classes tool.
Color by Class + image setting displays the points according to their class attribute and uses active image list to enhance visibility of details. This option renders points as small discs with image information rectified on it. Color of each point is specified by the class, whereas local brightness values are rectified from images. To change the colors for classes, use Define Classes tool.
This display option requires point cloud with image numbers stored, and respective image list to be loaded in TerraPhoto. This mode also benefits from normal vector computation.
A new input Color pts is added to the display mode dialog. This refers to TerraPhoto color point file for balancing brightness differences between images.
Color by Class + intensity setting combines class and intensity coloring. The color value is determined by the class while the brightness of the color indicates the intensity value.
The Colors button opens the Point classes dialog, the same dialog as for Color by Class. The brightness values for intensity cannot be changed.
Color by Class + depth setting combines class and depth coloring. The color value is determined by the class while the brightness of the color indicates the depth value.
The Colors button opens the Point classes dialog, the same dialog as for Color by Class. The brightness values for depth cannot be changed.
Color by Class difference setting compares two alternative classification results. The points with different class labels are displayed by class color. The points with no difference are assigned grayscale color based on intensity value. This creates visualization highlighting the classification differences with color.
The Colors button opens the Point classes dialog, the same dialog as for Color by Class. The brightness values for intensity are defined automatically.
Color by Color setting displays the points according to their color values. This requires that color values are assigned to the points. TerraScan can assign up to 10 color channels for each point. The maximum amount of color channels can only be stored in the TerraScan FastBinary format. LAS 1.4 format and later can store up to 4 color channels, LAS 1.2 format and later up to 3.
There are three channels available for displaying points by color. The color channel number can be selected from the list. Only channel with values <> 0 are selectable in the list. If colors have been extracted from 4-channel images, where the channels are 0=red (R), 1=green (G), 2=blue (B), and 3=near-infrared (NIR), the typical channel combinations for display are:
•R: 0, G: 1, B: 2 - true-color display, typical RGB color point display
•R: 3, G:1, B: 2 - infrared-color display
•same value for all channels - one-channel display
Color values for laser points can be extracted from raw images or raster attachments loaded into TerraPhoto, or assigned per class by setting values for red, green, and blue channels. See Extract color from images and Assign color to points for corresponding commands in TerraScan.
Color by Color + intensity setting combines color and intensity coloring. The color value is determined by the color values assigned to points while the brightness of the color indicates the intensity value.
Color by Density setting displays points according to the local point density. The density is defined as sphere radius of 5 times the average spacing of points using a local 3D neighborhood around each point. The denser the point cloud, the brighter the gray-scale value of the density coloring scheme. A new adjustment bar is added to the Display mode dialog which lets you adjust the coloring scheme more to the dark or bright side of the gray values.
The display option provides an understanding of density differences in point clouds, especially in MLS data or point clouds from static terrestrial scanners (TLS data). It also helps to identify the scanner position in TLS point clouds.
Color by Depth setting displays points based on the distance from the CAD view to the point. An automatically fitted gray scale scheme is used to represent the depth, making close by points light and distant points dark.
The display option is useful in interpretation of complex three dimensional environments, for example indoor data captures. It can highlight objects and distances already in the beginning of the work flow, before data is processed, colorized, or classified.
Using this color mode enables additional Hilite plane option. If enabled, application highlights points close the active depth with hot-to-cold color scheme. The color scheme is stretched to apply color for points within the set tolerance from the active depth.
Color by Deviation setting displays points according to the Riegl Extra Byte attribute Pulse deviation. A user-defined coloring scheme is used to represent the deviation values. The color definition works in the same way as for distance coloring.
A small deviation value indicates a normal shape return pulse. A big deviation value indicates an abnormal shape return pulse.
Color by Dimension setting displays points according to their dimension attribute. The dimension of a point is computed together with its normal vector. See Compute normal vectors command for more information.
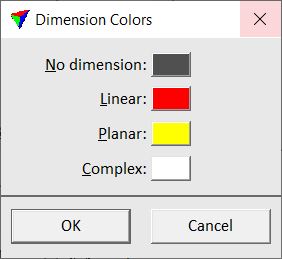
The Colors button opens the Dimension colors dialog.
The dialog lets you choose colors for displaying points with No dimension and for the three possible dimension types: Linear, Planar, and Complex. Click on the color field in order to select a color from the standard Windows dialog for color selection.
Color by Distance setting displays points based on the distance value. This requires that a distance value has been computed for points using the Compute distance command or macro action.
To color points by distance
1. Click on the Colors button next to the Class by field.
This opens the Distance Coloring Scheme dialog:
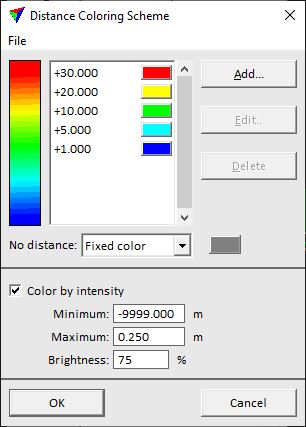
2. Define settings.
A distance color scheme can be saved into a file by using the File / Save as command of the dialog. This creates a text file with the extension .DCL. You can open a distance color scheme file by using the File / Open command of the dialog.
SETTING |
EFFECT |
|---|---|
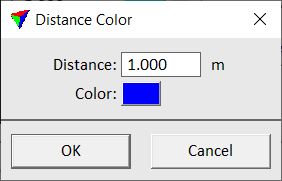
Add |
Add a new distance value and color to the scheme. The button opens the Distance Color dialog. Type a Distance value in the text field. Click on the Color field in order to open the standard Windows dialog for selecting a color. |
Edit |
Modify a distance value and color. Select a value-color pair in the list of the dialog. Click the button which opens the Distance Color dialog. Type a Distance value in the text field. Click on the Color field in order to open the standard Windows dialog for selecting a color. |
Delete |
Delete a distance value-color pair from the scheme. Select the value-color pair and click the button. |
No distance |
Display color for points without a distance value: •Fixed color - click on the color button next to the selection list in order to open the standard Windows dialog for selecting a color. •Color by intensity - intensity gray-scale values are used. |
Color by intensity |
If on, points outside the distance range defined in the color scheme are displayed with intensity gray-scale values. |
Minimum |
Minimum distance value for intensity display. This is active only if Color by intensity is switched on. |
Maximum |
Minimum distance value for intensity display. This is active only if Color by intensity is switched on. |
Brightness |
Determines the amount of white added to the intensity gray-scale scheme. A lower value makes the display darker, a higher value brighter. This is active only if Color by intensity is switched on. |
3. Click OK in the Distance Coloring Scheme dialog.
The software computes the distances.
4. Click Apply in the Display mode dialog in order to update the point display for the selected view.
After changes in distance values of points, the distance coloring can be updated in a fast way by using the Update Distance Coloring tool.
To create exact step-wise color-value pairs, add every color twice to the list and fix the lowest and highest value for the color. E.g., define yellow for value 20.000 and again for 29.999, followed by red for value 30.000. As a result, there is a clean change in color between value range 20 - <30 and 30+ instead of smooth transitions between the colors.
Color by Distance + intensity setting combines distance and intensity coloring. The color value is determined by the distance values assigned to points while the brightness of the color indicates the intensity value.
Color by Echo setting displays the points according to their return type.
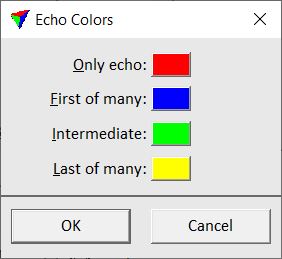
The Colors button opens the Echo Colors dialog.
The dialog lets you choose colors for displaying points of different echo types: Only, First of many, Intermediate, and Last of many. Click on the color field in order to select a color from the standard Windows dialog for color selection.
Color by Echo length setting displays points according to the length of the return pulse. The value is relative to a typical return pulse length on a hard surface. The echo length has to be extracted from waveform information. Alternatively, the Riegl Extra Byte attribute Pulse width is used in TerraScan as Echo length attribute, if available.
The Colors button opens the Coloring Scheme dialog, the TerraScan dialog for 256 Colors.
Color by Elevation setting displays the points according to their elevation value. A color scheme is applied where each color represents a range of elevation values. The default color scheme of TerraScan consists blue colors for low elevation values, green and yellow colors for intermediate values, and red colors for high elevation values with smooth transitions between the colors.
Fit to view. If on, the colors are adjusted dynamically to the elevation range of points that are currently visible in a view extend. This leads to a better visualization of points when views are zoomed or panned.
The Colors button opens the Elevation Coloring Scheme dialog:
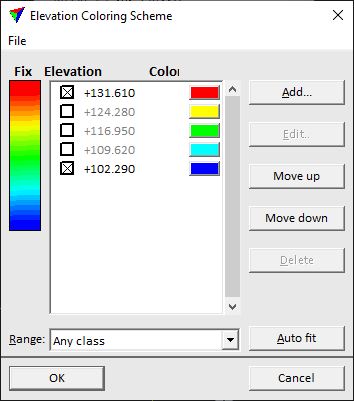
A distance color scheme can be saved into a file by using the File / Save as command of the dialog. This creates a text file with the extension .ECL. You can open an elevation color scheme file by using the File / Open command of the dialog.
The square toggle button next to an elevation value can be used to fix a value. If on, the elevation value does not change when moving value-color pairs up/down in the color scheme.
SETTING |
EFFECT |
|---|---|
Add |
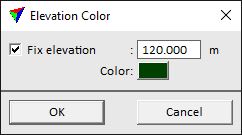
Add a new elevation value and color to the scheme. The button opens the Elevation Color dialog. Switch on Fix elevation and type an Elevation value in the text field. Click on the Color field in order to open the standard Windows dialog for selecting a color. |
Edit |
Modify an elevation value and color. Select a value-color pair in the list of the dialog. Click the button which opens the Elevation Color dialog. Switch on Fix elevation and type an Elevation value in the text field. Click on the Color field in order to open the standard Windows dialog for selecting a color. |
Move up |
Moves an elevation value-color pair up in the scheme. The elevation value is adjusted automatically. |
Move down |
Moves an elevation value-color pair down in the scheme. The elevation value is adjusted automatically. |
Delete |
Delete an elevation value-color pair from the scheme. Select the value-color pair and click the button. |
Range |
By default, the range for the color ramp includes the elevation values of all loaded points. This can be changed by selecting a class in the Range from list. The list contains the active classes in TerraScan. Then, only the elevation values of the selected class are applied to the color scheme. |
Auto fit |
Removes outliers from the color scheme by fixing the lowest and highest elevation values. This results in a color scheme where outliers do not affect the color distribution in the coloring scheme. In addition, all other elevation values are equally distributed within the scheme and intermediate fixed values are switched off to be flexible. The auto fit action can be performed automatically whenever points are loaded into TerraScan if the corresponding setting in Point display category of TerraScan Settings is switched on. |
To create exact step-wise color-value pairs, add every color twice to the list and fix the lowest and highest value for the color. E.g., define yellow for value 20.000 and again for 29.999, followed by red for value 30.000. As a result, there is a clean change in color between value range 20 - <30 and 30+ instead of smooth transitions between the colors.
Color by Elevation + Intensity
Color by Elevation & Intensity setting combines elevation and intensity coloring. The color value is determined by the elevation while the brightness of the color indicates the intensity value.
Color by Extra attribute setting displays the points by a specified extra attributes. The color value is determined by the attribute value following the specified colors.
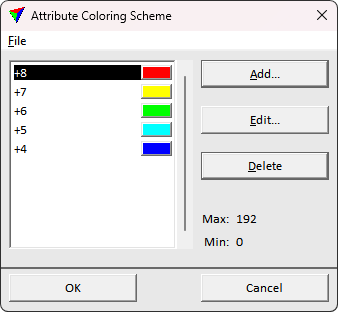
The Colors button opens Attribute coloring scheme dialog for specifying the display colors.
Open existing coloring scheme, or save the active coloring scheme using the File pulldown menu options. Add, modify, or remove color steps using the dialog buttons. The Max and Min values indicate the attribute value interval of the open points.
Color by Group setting displays points according to their group number. This requires that a group number has been assigned to points. See Assign groups command for more information. The coloring mode uses colors of the active color table of the CAD file.
You can use the Shuffle button in order to change the color values for the groups.
Color by Group & Intensity setting combines group and intensity coloring. The color value is determined by the group while the brightness of the color indicates the intensity value.
You can use the Shuffle button in order to change the color values for the groups.
Color by Image assignment setting displays points according to their image number. This requires that an image number has been assigned to points. This can be achieved by extracting color from images for loaded points or project block binary files. The coloring mode uses colors of the active color table of the CAD file.
A new setting Draw seamlines is added to the Display mode dialog. If on, image seamlines are displayed temporarily.
Color by Image + color renders a point as a small disc with image information rectified on it. This display mode combines good parts of images and point cloud. It includes all the details captured in image data while showing the captured three dimensional geometry.
This display option requires point cloud with image numbers stored, and respective image list to be loaded in TerraPhoto. This mode also benefits from normal vector computation.
A new input Color pts is added to the display mode dialog. This refers to TerraPhoto color point file for balancing brightness differences between images.
Color by Intensity auto/custom
Color by Intensity custom/auto settings display the points according to their intensity value. The default gray scale of TerraScan stretches from dark gray for low intensity values to white for high intensity values.
Intensity auto uses a more homogeneous gray-scale coloring scheme. The intensity values are fitted to the gray values of the coloring scheme in a way that each gray value gets a similar amount of points. This results in a smoother intensity display, especially if intensity values are not normal-distributed. The Save As button opens the Save intensity auto scheme dialog, a standard dialog for saving files. You can save the gray value scheme to a text file with the extension .CLR.
Intensity custom uses the CAD file color table and fits the intensity values to the gray-scale color values. The Colors button opens the Coloring Scheme dialog, the TerraScan dialog for 256 Colors.
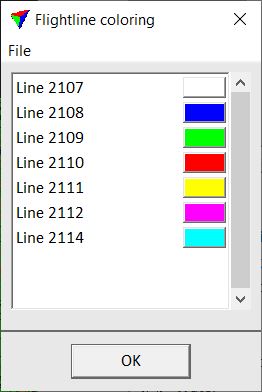
Color by Line setting displays the points according to their line number. By default, the soft ware uses the first seven colors from the active color table of the CAD file for coloring points.
The Colors button opens the Line coloring dialog.
The dialog lets you choose colors for displaying points of different line numbers. Select a line from the list. Click on the color field in order to select a color from the standard Windows dialog for color selection.
Color by Line & Intensity setting combines line and intensity coloring. The color value is determined by the line while the brightness of the color indicates the intensity value. This can be used, for example, to check the horizontal accuracy of overlapping line.
The Colors button opens the Line coloring dialog, the same dialog as for Color by Line. The brightness values for intensity can not be changed.
Color by Normal setting displays points according to the direction of a slope. This requires the computation of normal vectors. The colors of a color circle are used for the possible slope directions, starting from red for slopes facing to North-East via blue and green in clockwise direction.
A new setting Color limit is added to the Display mode dialog. The percentage refers to the gradient of a slope where 0 corresponds to a horizontal surface. If the gradient of a surface is smaller than the given percentage value, the saturation of the colors decreases. Horizontal surfaces are displayed in gray. The value may vary from 0 to 179 degree.
Color by Normal & Intensity setting combines slope and intensity coloring. The color value is determined by the normal vector computed for a point while the brightness of the color indicates the intensity value.
A new setting Bright display is added to the Display mode dialog. If on, the brightness of intensity values is increased. This makes the slope colors better visible in point clouds with rather dark intensity values.
Color by Reflectance setting displays points according to the Riegl Extra Byte attribute Reflectance. An automatically fitted gray scale scheme is used to represent the attribute. The display is very similar to intensity coloring for ALS data.
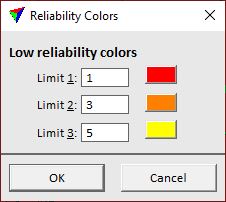
Color by Reliability setting displays points according to the Agisoft attribute Confidence. The value indicates from how many images a point is generated. The more images are involved, the more confident a point is generated.
The Colors button opens the Reliability Colors dialog.
The dialog lets you choose colors for displaying points of low reliability. Click on the color field in order to select a color from the standard Windows dialog for color selection.
Color by Scanner setting displays the points according to their scanner number. This is useful to distinguish points collected by different scanners of a multi-scanner system.
The Colors button opens the Scanner coloring dialog, the same dialog as for Color by Line.
Color by Scan direction setting displays the points according to the scan direction. A point may be recorded in negative or positive scan direction, or as edge point. This requires that laser points are stored in LAS files. The display is based on the scan direction and edge of flight line bit fields present in LAS files.
Color by Shading setting displays a triangulated surface of the points colored by class and shaded by triangle slope. This is useful, for example, to check ground classification results because error ground points show up clearly in the shaded surface display.
If Color by Shading is selected, three more settings are added to the Display mode dialog:
•Azimuth - direction of the light source. Zero is north and positive values increase clockwise.
•Angle - height above horizon of the light source.
•Dynamics - if on, the point cloud is displayed in dynamic views, for example if the view is moved or rotated with CAD tools. This slows down the movement speed. If off, the point cloud is only drawn in static views.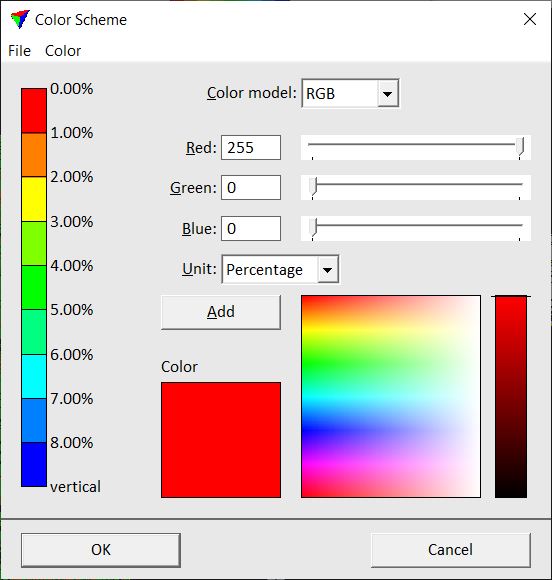
Color by Slope setting displays points according to the gradient of a slope. This requires the computation of normal vectors.
The Colors button opens the Color Scheme dialog.
To define a new color scheme or modify a color scheme:
1. Select a Unit for expressing slope gradients: Degree or Percentage.
2. Follow the steps for color scheme definition.
3. Click OK.
Color by Splat setting displays Gaussian Splats. This requires point cloud with special Gaussian splat attributes, and TerraSplat or TerraStereo loaded. Gaussian splatting is a highly photo realistic visualization technique visualizing each point with some width, height and transparency.
Color by Time setting displays the points according to time stamp intervals. A new setting Separation is added to the Display mode dialog. It determines how long a time interval is for drawing points in one color. A time interval can be defined in seconds, minutes, hours, days, weeks or years.
The display option provides an understanding of the scan pattern, for example for data captured with a hand-held scanner. For ALS data, by using a large time interval, the display is approximately the same as color by line.
The display option requires that times stamps are stored for the points.
Color by Time + Intensity setting combines time and intensity coloring. The color value is determined by the time stamp interval while the brightness of the color indicates the intensity value.
Color by Vegetation index setting displays points according to a color channel computation. The display method is available if colors of multiple channels are extracted for the point cloud. The display mode provides two implemented methods for computing the vegetation index.
Normalized difference
The method assumes that channel 0 stores red (R) and channel 3 near-infrared (NIR) color values. The normalized difference value is computed with the following equation:
ND = (NIR - R) / (NIR + R) -1 <= ND <= +1
Visual band difference
The method assumes that channel 0 stores red (R), channel 1 green (G), and channel 2 blue (B) color values. The visual band difference value is computed with the following equation:
VBD = (2*G - R - B) / (2*G + R + B) -1 <= VBD <= +1
In the Point display category of TerraScan Settings, a threshold value is defined for each vegetation index computation method. If the difference value of a point is smaller than the threshold, the point is displayed with intensity coloring (non-vegetation). If the difference value of a point is larger than the threshold, the point is displayed with a green coloring (= vegetation). The higher the vegetation index, the brighter the green.
In addition to the implemented methods, the list may include any User vegetation indexes defined in the corresponding category of TerraScan Settings.