

TerraScan User Guide
Find Danger Objects
 Find Danger Objects tool finds points which are within a given distance from vectorized wires. In addition, it lets you create reports in order to document danger point locations.
There are three different methods how the distance between wires and the danger objects can be defined:
•Vertical distance to wire - points within a vertical distance from the wire and within a given offset from the tower string.
•3D distance to wire - points within a 3D radius around a wire.
•Falling tree logic - each point in the source class is considered as the tip of a tree with its trunk at the xy location of this point and the elevation of the base point on the ground. If the point “falls like a tree” and falls into a 3D buffer area around a wire, it is listed as a danger point. The method requires a ground classification.
The tool produces a list of potential danger points. The list is traversable, you can scroll through the list and check each location.
A general workflow example for reporting danger object locations along a powerline is:
1. Detect wires by following the workflow for powerline processing as suggested, for example, at the beginning of the Powerlines chapter.
2. Start the Find Danger Objects tool. Use any class with points on potential danger objects as Object class. Report danger points By minimum interval to get at least one point from each potential danger object.
3. Check the list of danger points. Use the Classify button to classify points on danger objects into a separate class. Use the Remove button to remove points from the list if they are not on danger objects (such as noise close to the wires).
4. Save the point cloud after classifying danger points.
5. Close the Danger Objects dialog.
6. Start the Find Danger Objects tool again. Use the point class with points on danger objects as Object class. Set Report to All to get a list of all danger points.
7. Setup the view display in a way that suites for creating HTML reports. For creating text reports, no view setup is required.
8. Create a text report by using the File / Output report command or HTML reports by using the File / Write HTML command.
To find danger points:
1. Activate the tower string element using the Activate Powerline tool.
2. Select the Find Danger Objects tool.
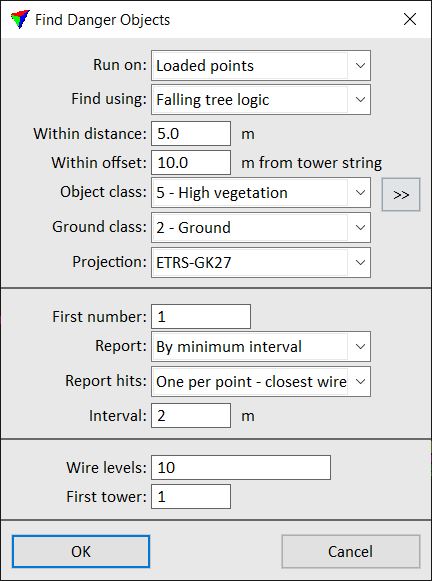
This opens the Find Danger Objects dialog:
SETTING |
EFFECT |
|---|---|
Run on |
Source data used for danger object detection: •Loaded points - points loaded in TerraScan. •Active project - points in blocks of the active project in TerraScan. |
Find using |
Method of danger object detection: Vertical distance to wire, 3D distance to wire or Falling tree logic. |
Within distance |
Radius that defines a 3D buffer around a wire. The buffer is added to a wire for computing distances to points. |
Within offset |
Horizontal distance from the tower string element that defines a corridor. Danger objects are searched within this corridor. |
Object class |
Point class(es) from which to search danger objects. |
|
Opens the Select classes dialog which contains the list of active classes in TerraScan. You can select multiple source classes from the list that are then used in the Object class field. |
Ground class |
Class that contains points on the ground. This is active only if Find using is set to Falling tree logic. |
Projection |
Projection system that is used for the data set. This is required for writing latitude/longitude values into output reports. |
First number |
Number of the first potential danger point in the list. |
Report |
Reporting frequency: •All - each danger point is reported. This is useful, for example, if points on danger objects are already classified and you want to create reports for danger objects. •One for every span - only the danger point with the smallest distance within a span (distance between two towers) is reported. •By minimum interval - danger points are reported every given Interval distance. This is useful if you want to detect danger objects and classify points on them into another point class. |
Report hits |
Hits on danger objects to report: •One per point - closest wire - for each potential danger point in the point cloud, only the distance to the closest wire is reported.The distance to other wires is not reported even if it is also within the critical distance. •Multiple - all wires - for each potential danger point in the point cloud, distances to all wires are reported if they are within the critical distance. |
Wire levels |
CAD file level(s) on which the vectorized wire elements are placed. Separate several level numbers by a comma or minus, for example 1-10,13. Use 0-63 for all levels. |
First tower |
Number of the tower at the first vertex of the selected tower string. |

3. Define settings and click OK.
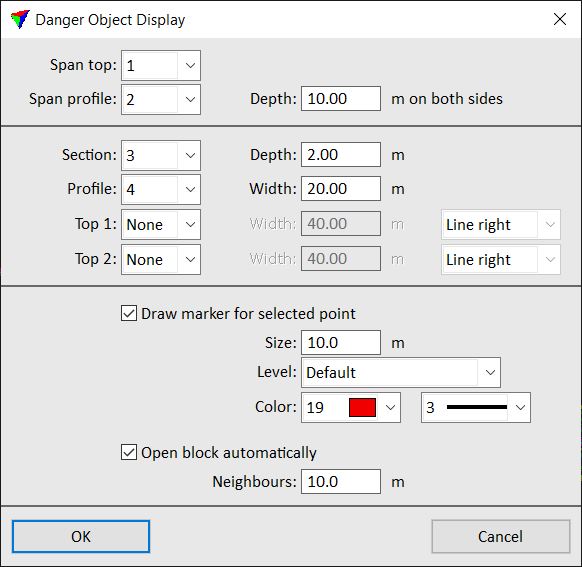
The application searches for danger points. When the search is complete, the Danger Object Display dialog opens:
SETTING |
EFFECT |
|---|---|
Span top |
Number of CAD file view used for displaying a span (distance between two towers) in a top view. |
Span profile |
Number of CAD file view used for displaying a span in a profile view. The centerline of the profile is defined by the tower string element, the depth by the Depth value. |
Section |
Number of CAD file view used for displaying a danger point location in a section view. The centerline of the section runs perpendicular to the tower string, the depth is defined by the Depth value. |
Profile |
Number of CAD file view used for displaying a danger point location in a profile view. The centerline of the profile is defined by the tower string element, the width by the Width value. |
Top 1, Top 2 |
Number of CAD file view used for displaying a danger point location in a top view. The width of the area shown in the view is defined by the Width value. The orientation of the view is defined by the selected option: •North up - north direction points to the top edge of the view. •Line up - the tower string element runs from the bottom to the top edge of the view. •Line right - the tower string element runs from the left to the right edge of the view. |
Draw marker for selected point |
If on a temporary marker is drawn for a danger point that is selected in the list. The marker is drawn with the given Size, on the selected Level and using the Color and line weight settings. |
Open block automatically |
If on, points from the block at the danger point location are loaded automatically. Points from neighbouring blocks are loaded in the given Neighbours distance. |
4. Define settings and click OK.
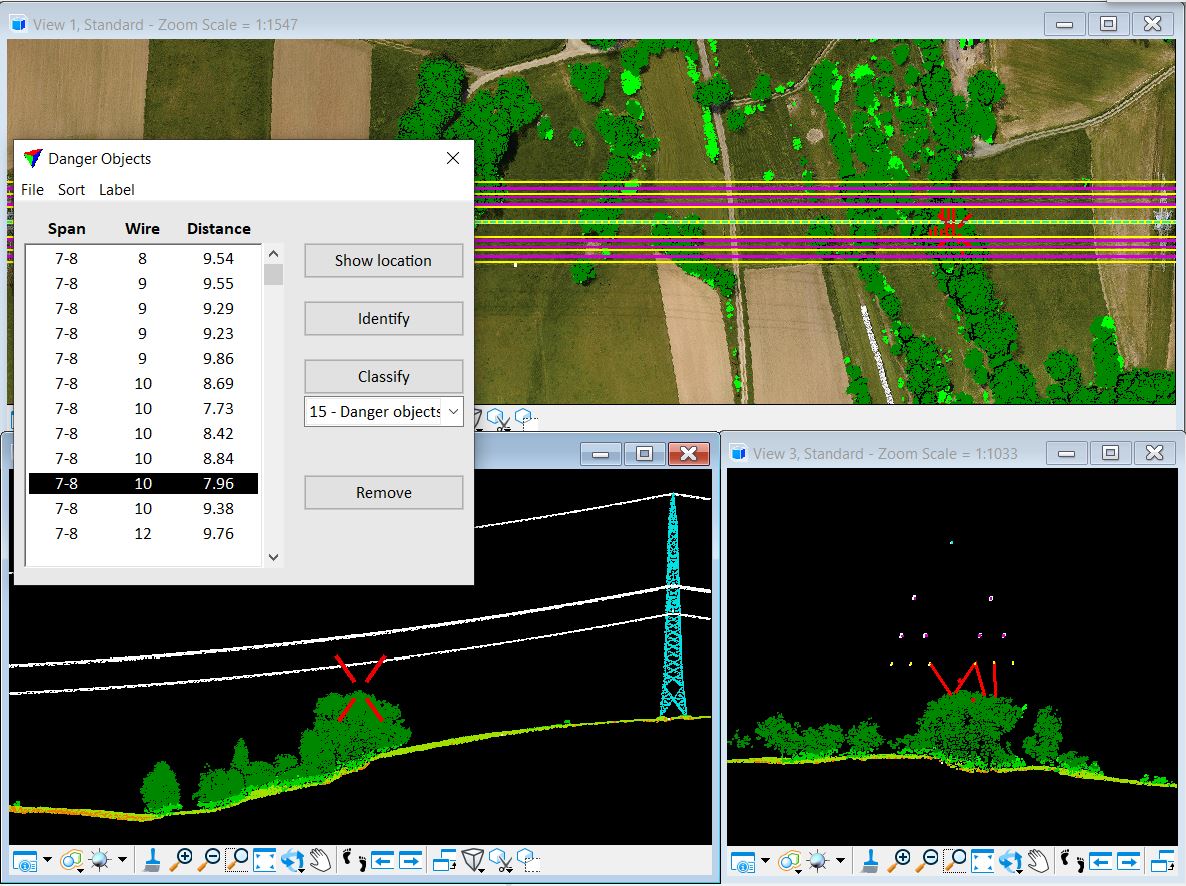
The Danger Objects dialog is now accessible:
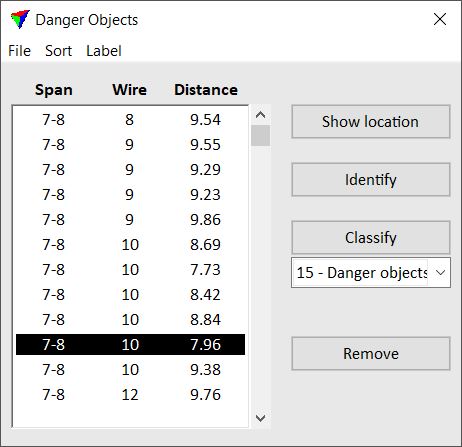
The list contains all detected danger points. For each danger point, it shows the span (start and end tower numbers), wire number, and distance between the wire and the danger point. If you click on a row, the application automatically updates the previously defined CAD file views to display that danger point location.
The Danger Objects dialog contains several menu and button commands for viewing, classifying, labeling and reporting danger locations.
The list can be sorted using commands from the Sort pulldown menu.
The danger point locations can be labeled using commands from the Label pulldown menu. A label consists of a line and a text element. The line represents the shortest distance between the wire and the danger point. The text element shows the distance value in CAD file units.
TO |
USE COMMAND |
|---|---|
Output danger locations to a text file |
|
Output danger locations to an HTML file |
|
Classify all danger points into another class |
|
Change the view setup for danger point display |
|
Sort list by danger point distance |
Sort / By distance |
Sort list by wire number and secondarily by distance |
Sort / By wire and distance |
Sort list by span and secondarily by wire number |
Sort / By span and wire |
Sort list by span and secondarily by distance |
Sort / By span and distance |
Label the selected danger point in 3D position |
Label / In 3d |
Label the selected danger point in a profile drawing |
Label / In profile |
Label all danger points in 3D |
Label / All in 3d |
Label all danger points in a profile drawing |
Label / All in profile |
Show the location of the selected danger point in a view |
Show location |
Identify a danger point at a certain location |
Identify |
Classify the selected danger point to the given point class |
Classify |
Remove the selected row from the list |
Remove |
Output report command creates a report in a text file format. You can decide what information is included in the report. The result is a delimited text file that can be opened in text editors or spread sheet applications.
To create a report in text file format:
1. Select Output report command from the File pulldown menu.
This opens the Output Danger Points dialog:
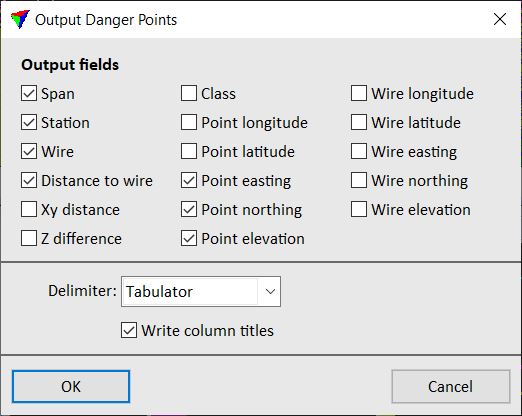
2. Select fields to be included in the report.
Longitude and latitude values can only be computed if the projection system of the data is known. The correct projection system must be selected in the Find Danger Objects dialog. See Find Danger Objects tool for a description of the dialog.
3. Select a Delimiter character.
4. (Optional) Switch on Write column titles in order to add the field names as column titles to the report.
5. Click OK.
This opens the Danger point output file dialog, a standard Windows dialog for saving files.
6. Define a storage location, name, and extension for the report and click Save.
This creates the report file.
Write HTML command creates a report in HTML format. The report may contain images and textural information of each danger point location. You can decide what information is included in the report.
The command uses an HTML template that defines the layout of the report. The template defines variables for the textural information and placeholders for images. The following tables list all variables that can be included in report templates:
VARIABLE |
TEXT CONTENT |
|---|---|
#dgrnumber |
Point number |
#dgrspan |
Span (start-end tower) |
#dgrwire |
Wire number |
#dgrdist |
Distance to wire |
#dgrstation |
Distance from start tower |
#dgrclass |
Point class |
#dgrx |
Easting coordinate |
#dgry |
Northing coordinate |
#dgrz |
Elevation |
#dgrlon |
Longitude |
#dgrlat |
Latitude |
VARIABLE |
CAPTURED VIEW |
|---|---|
#spantop |
Span top view as set in the Danger Object Display dialog. |
#spanprofile |
Span profile view as set in the Danger Object Display dialog. |
#section |
Section view as set in the Danger Object Display dialog. |
#profile |
Profile view as set in the Danger Object Display dialog. |
#top1 |
Top 1 view as set in the Danger Object Display dialog. |
#top2 |
Top 2 view as set in the Danger Object Display dialog. |
An example template is provided in the EXAMPLE folder of a TerraScan installation, for instance in C:\TERRA64\EXAMPLE\DANGERPOINT_REPORT.HTML.
Longitude and latitude values can only be computed if the projection system of the data is known. The correct projection system must be selected in the Find Danger Objects dialog. See Find Danger Objects tool for a description of the dialog.
The view setup determines the size of the images saved for the report. The content of the images is defined by the visibility of data in the views. Images may contain orthophotos attached as raster reference files in TerraPhoto or MicroStation, point cloud data displayed in TerraScan, and vector data in the CAD file.
If point cloud data from a TerraScan project is included in the images and reports are written for all danger points, it is required to switch the Open block automatically option on in the Danger Object Display dialog.
In the default template, there are placeholders for three images: a span top view, a section view, and a profile view. An example view setup for producing images from these three views is illustrated in the following figure. The views contain point cloud data colored by class, vector data for wires, and labels for danger points. In the span top view, the visibility of some point classes is switched off and orthophotos attached as TerraPhoto references are displayed.
To create a report in HTML format:
1. Arrange the views in a way that fits to your report template. Set the visibility of data.
2. Select Write HTML command from the File pulldown menu.
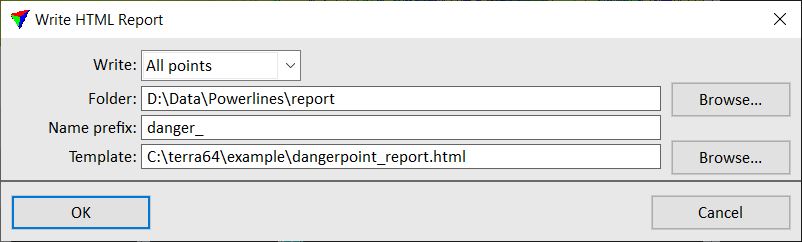
This opens the Write HTML Report dialog:
3. Define settings and click OK.
This creates the report file(s) and the image(s). The names of the image files are a combination of the view type and an increasing danger object number, for example "spantop1.jpg", "section1.jpg", "profile1.jpg" are the images for the report file "report1.html". Images are stored as JPEG files.
SETTING |
EFFECT |
|---|---|
Write |
A report is written: •All points - for all danger points in the list. •Selected point - for the danger point selected in the list. |
Folder |
Location where the reports are stored. |
Name prefix |
Defines the name prefix for the report files. The name is a combination of the prefix and the danger object number. |
Template |
Storage location and name of the HTML template file. |
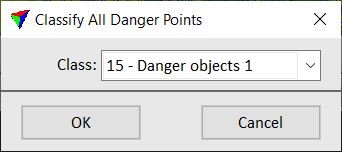
Classify all command classifies all danger points in the list into another point class. The target class is defined in the Classify all danger points dialog:
Another automatic way to classify more points on danger objects is provided by the Wire danger points routine.
Display setting command opens the Danger Object Display dialog described above.