

TerraScan User Guide
File formats / User group parameter formats
User group parameter formats category in File formats folder contains a list of user-defined group parameter formats. You can define your own formats which can be used to Write group parameters. The file format definition determines what parameters are included for each group and what is the order of the parameter fields in the output file.
You can Add, Edit and Delete group parameter formats by using the corresponding buttons in the Settings dialog. The Copy button creates an identical copy of a selected format definition. The Move up and Move down buttons change the order of formats in the list.
Define a new group parameter format:
1.Open the User group parameter formats category inside the File formats folder in the TerraScan Settings dialog.
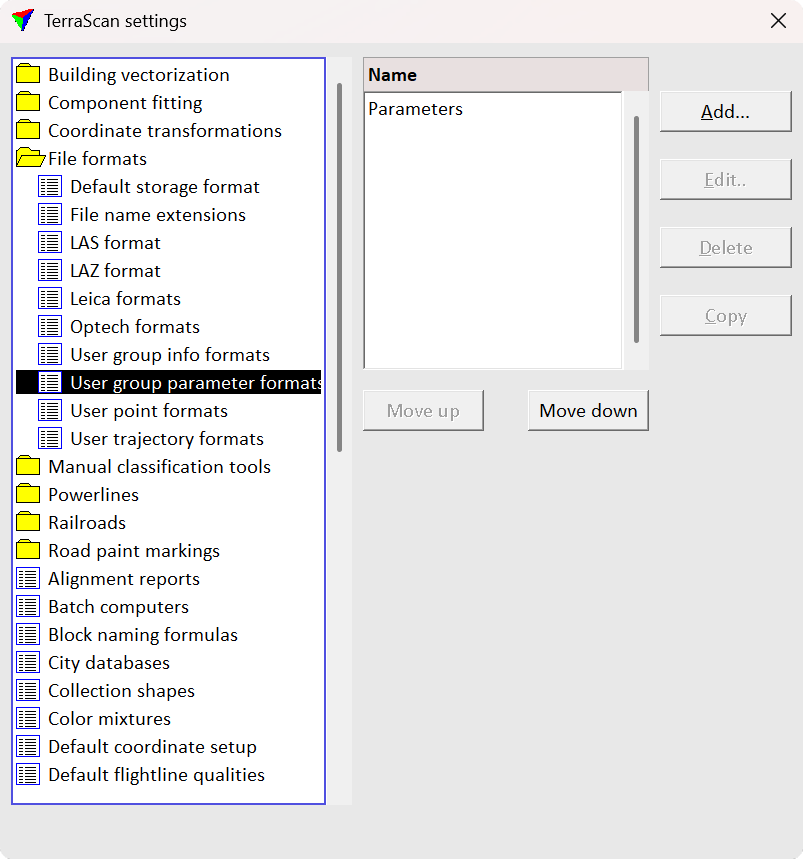
2.Click Add in the TerraScan Settings dialog. The Group Parameter File Format dialog opens:
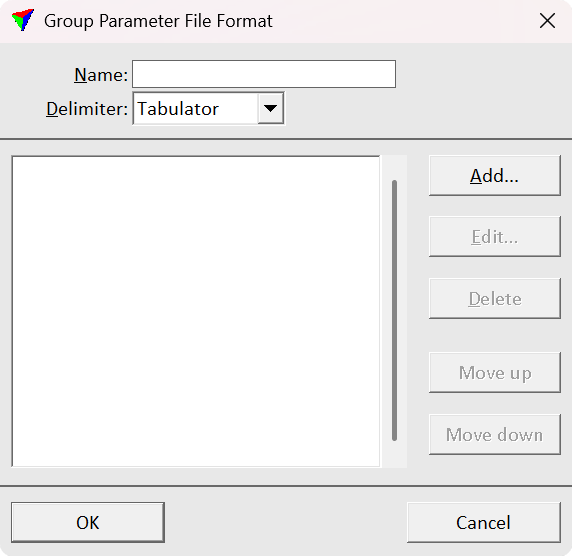
3.Type a Name for the format.
4.Select a Delimiter for separating the attribute fields in the output file. The fields in the output files are delimited by either comma, space, tabulator or semicolon.
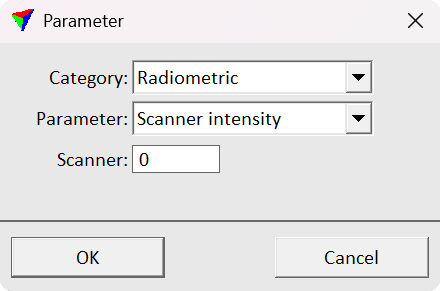
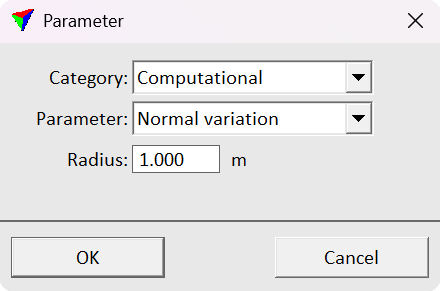
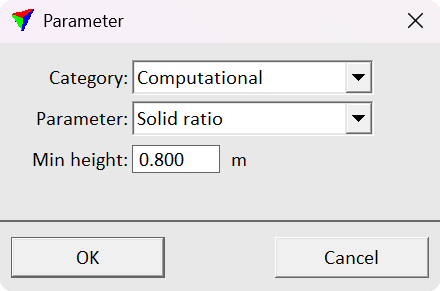
5.Click Add in order to add new attributes to the format. The Parameter dialog opens:
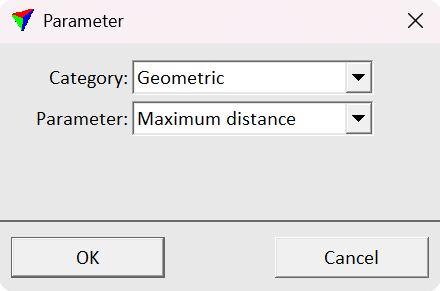
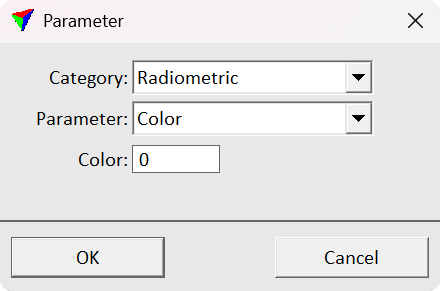
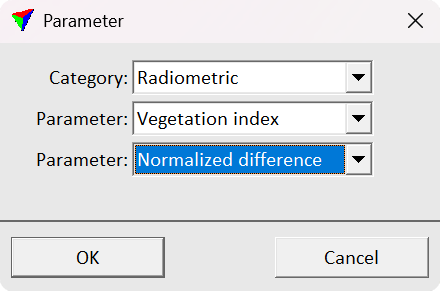
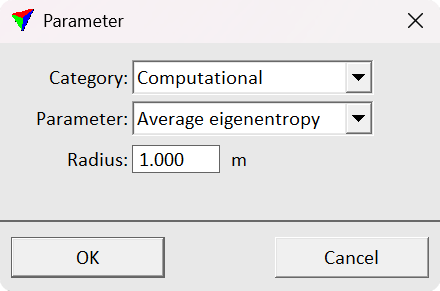
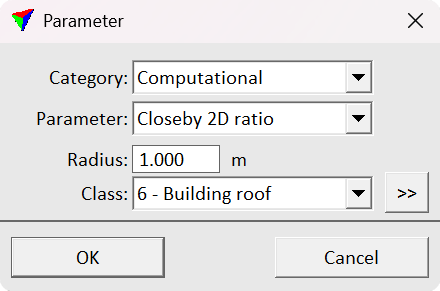
6.Select a Category of the parameter. The categories are Basic, Geometric, Radiometric, Computational and Shape.
7.Select a parameter from the Parameter drop-down menu and click OK. This adds the parameter to the list in the Group Parameter File Format dialog. Repeat steps 5, 6 and 7 for all parameters you want to add to the group parameter file format.
8.Click OK in the Group Parameter File Format dialog.
9.Close the Settings dialog in order to save the modified TerraScan settings.
User group parameter formats are stored in a configuration file GROUP_PARAMETER_FORMAT.INF in the TerraScan installation folder. You can copy this file to other computers to use the formats on them.
The following attributes can be added to a group parameter output file:
•Area
•Hue
Basic parameters
TerraScan group identifier number.
TerraScan class number.
Geometric parameters
2D area of the group from the enclosing polygon.
An average height from the ground.
A normalized value (0-1) indicating where the average z value lies between the minimum and maximum z values. Values near 0 mean the average is closet to the minimum, while values near 1 mean it is closer to the maximum.
2D area of the group divided by the area of the enclosing circle.
A sharpness of the top of the group.
How long perimeter is compared to a rectangle with the same area.
How many of the points are on the edge.
Maximum z minus minimum z.
A length of the group based on 2D line fitted through the points.
The smallest height from ground value in the group.
Largest height from ground value in the group.
2D area of the group divided by the area of the rotated bounding box.
A volume of the group using a voxel based computation.
Width of the group based on a 2D line fitted through the points.
Radiometric parameters
An average amplitude value.
A variation of the amplitude values.
An average HSV color brightness of the points.
An average color value of a color channel. Specify the color channel in the Color field.
An average HSV color hue of the points.
An average intensity value.
A variation of the intensity values.
An average reflectance value.
A variation of the reflectance values.
An average HSV color saturation of the points.
An average intensity value of the points from a selected scanner. Specify the scanner in the Scanner field.
An average amplitude value of the points from a selected scanner. Specify the scanner in the Scanner field similarly as with Scanner intensity.
An average reflectance value of the points from a selected scanner. Specify the scanner in the Scanner field similarly as with Scanner intensity.
An average vegetation index value (NDVI, VBDVI or user defined). Specify the index in the Parameter drop-down menu. You can define own vegetation indexes in User vegetation indexes.
Computational parameters
An average eigenentropy value of the points inside a selected radius. Specify the radius in the Radius field.
An average omnivariance value of the points inside a selected radius. Specify the radius in the Radius field similarly as with Average eigenentropy.
An average scatter value of the points inside a selected radius. Specify the radius in the Radius field similarly as with Average eigenentropy.
A fraction of the points with a nearby neighbor of the given class in 2D. The values range from 0 (= none of the points have a neighbor point from the specified class in the radius) to 1 (= all the points have a point from the specified class in the radius). Specify the radius in the Radius field and class in the Class drop-down menu.
Same as the Closeby 2D ratio, but with neighbors searched in 3D space instead of 2D.
A relative number of points with a complex dimension. Requires computed dimensions for the points. The dimensions are computed when running the Compute normal vectors tool.
A value describing how vertical normal vectors are. Requires Compute normal vectors.
A fraction of the points with a linear dimension. Requires computed dimensions for the points. The dimensions are computed when running the Compute normal vectors tool.
A variation of the normal vector values inside a radius. Specify the radius in the Radius field.
A fraction of the points with a planar dimension. Requires computed dimensions for the points. The dimensions are computed when running the Compute normal vectors tool.
An average difference of the points to a plane fitted to the group.
An average mismatch of the points to a plane fitted to neighbors.
A fraction of the points that are the last echo and above a given minimum height from the ground. Specify the minimum height in the Min height field.
An average mismatch of the points to a second degree surface fitted to neighbors.
A fraction of the points with a non-last echo attribute value.
A value describing how horizontal normal vectors are. Requires Compute normal vectors.
An eigenentropy value computed from all the points in the group.
An omnivariance value computed from all the points in the group.
A scatter value computed from all the points in the group.
A value describing how vertical a fitted 3D line is.
Shape parameters ranging from Shape 01 to Shape 15 describe the spatial distribution of points within a group. They are derived from mathematical descriptors known as Flusser–Suk moments and provide a representation of overall shape geometry.
The first parameter represents the relative position of the group’s center (center of mass). Subsequent parameters describe the distribution of points along the x, y, and z axes, capturing properties such as elongation, flatness, and compactness.
Higher-order parameters characterize asymmetry in the distribution, analogous to skewness, and enable differentiation between regular and irregular or tilted shapes.
These parameters are most effectively used collectively as a compact mathematical representation of the shape.