Test parameters
Not Lite
Test parameters command can be used to test parameters for the differentiation of point groups. The testing is done based on sample groups which need to be defined before running the command. As a result of the testing, a parameter file can be saved. This is then used to classify points with the By parameters routine for point groups.
There are several parameters which may be used to distinguish groups:
•Transparency - number of returns or density of points.
•Intensity - intensity values. Requires intensity values stored for points.
•Scanner 1|2|3 intensity - intensity values of different scanners/wavelengths. Requires data from a multiple-wavelength scanner.
•Color brightness - brightness values.
•Color red|green|blue - color values in red, green, blue channel. Requires color values stored for points.
•Color N - near-infrared value. Requires a near-infrared value stored for points.
•Complex|Planar|Linear ratio - dimension ratio. Requires normal vector and dimension computed for the points.
•Crown sharpness - shape of a tree crown.
•Height - height from ground.
•Width to height - width to height ratio of a group.
•NDVI - normalized differential vegetation index.
A typical use case for Test parameters is the recognition of tree types from multi-spectral point clouds. The point cloud may be produced by a multi-wavelength scanner, from near-infrared stereo image pairs or by assigning color values from near-infrared images to a LiDAR point cloud. The workflow for classifying points of trees of different types into separate classes can be outlined as follows:
2.Compute distance from ground for above ground points.
3.Classify by distance from ground. Points on trees are classified into High vegetation class.
4.Assign groups to points in High vegetation class.
5.Classify trees using the Best match routine.
6.Classify sample trees into separate classes. There should be a few sample groups for each tree type.
7.Test parameters based on the sample groups. Depending on the source data, there may be a combination of 2-4 parameters that give the best probability of separating the tree types.
8.Save a parameter file.
9.Classify the data set using the parameter file.
To test parameters and save a parameter file:
1. Compute the distance from ground using the Compute distance command or corresponding macro action.
2. Assign groups using the Assign groups command or corresponding macro action.
3. Define sample objects by classifying groups manually or automatically into separate classes.
4. Select Test parameters command from the Group pulldown menu.
This opens the Select Test Classes dialog:
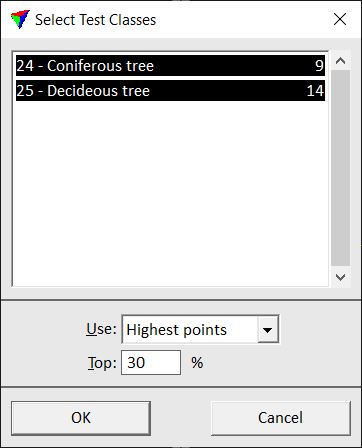
The upper part of the dialog shows a list with all classes for which groups are assigned and the amount of sample groups for each class.
5. Select classes you want to use for testing. Define additional settings.
Setting |
effect |
|---|---|
Use |
Determines which points from the selected classes are used for deriving parameters: •All points - all points. •Only | First | Last echoes - only points of the given echo type. •Highest points - the highest points are used. The value given in the Top field determines the percentage of highest points measured from the ground to the top point. |
6. Click OK.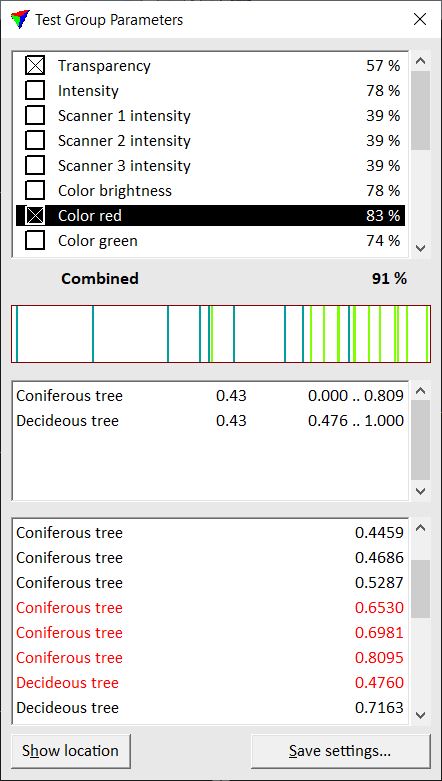
This opens the Test Group Parameters dialog.
The upper part of the dialog shows a list of parameters and their certainty of distinguishing the sample classes from each other. The parameter with the highest certainty percentage is selected automatically. The combined percentage value below the list shows the final certainty of differentiation if several parameters are selected.
The central part of the dialog illustrates how good the sample classes can be distinguished by a selected parameter. The black field represents a statistical value from 0.0 to 1.0. The colored bars in the field show where the sample groups are located within the range of 0.0 to 1.0. If the sample groups overlap, the differentiation is less certain as if groups are clearly separated. The color of the bars is determined by the class color settings in TerraScan. The field below also shows for each sample group where it is located in the range between 0.0 and 1.0. In addition, a weight factor is displayed.
The lower part of the dialog contains a list of all sample groups and their statistical value of a selected parameter. Critical sample groups that overlap with groups from other classes are displayed in red. A selected sample group can be centered in a view by using the Show location button and placing a data click inside the view.
7. Select different parameters and check how well they distinguish the sample classes. Switch on all parameters that you want to use in the final parameter set.
8. Click on the Save settings button.
This opens the Group parameter file dialog, a standard dialog for saving files.
9. Define a location and name for storing the parameter file and click Save.
This saves the parameters into a text file.