

TerraModeler User Guide
Output control report
Output control report command creates a report of elevation differences between a surface model and control points. This can be used to check the elevation accuracy of the surface model and to calculate a correction value for improving the elevation accuracy of the model.
The control points have to be stored in a space delimited text file in which each row has four fields: identifier, easting, northing, and elevation. The identifier field is normally a number but it may include non-numeric characters as well.
To create a control report:
1. Select Output control report command from the Utility pulldown menu.
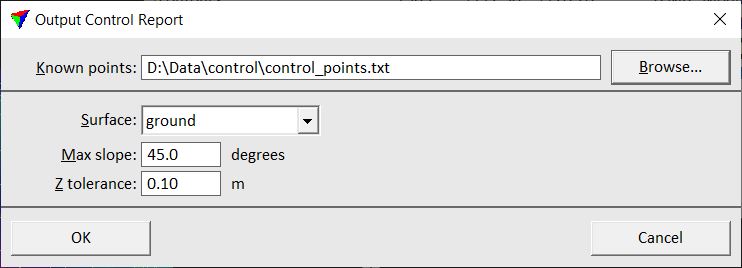
This opens the Output Control Report dialog:
2. Select the text file that stores the control points.
3. Define settings and click OK.
This calculates the elevation differences and opens the Control report window.
Setting |
Effect |
|---|---|
Known points |
Name and location of the file that stores the coordinates of the control points. |
Surface |
Surface model used for comparison with the control points. |
Max slope |
Maximum terrain slope for which an elevation difference is computed. |
Z tolerance |
Elevation variation in the surface model points. This value is used only when computing the terrain slope so that small triangles do not exceed the Max slope value. |
The Control report window shows the coordinates of the control points, the surface elevation values at control point locations and the elevation difference at control point locations. Below the list of control points, the statistical values for the control report are displayed.
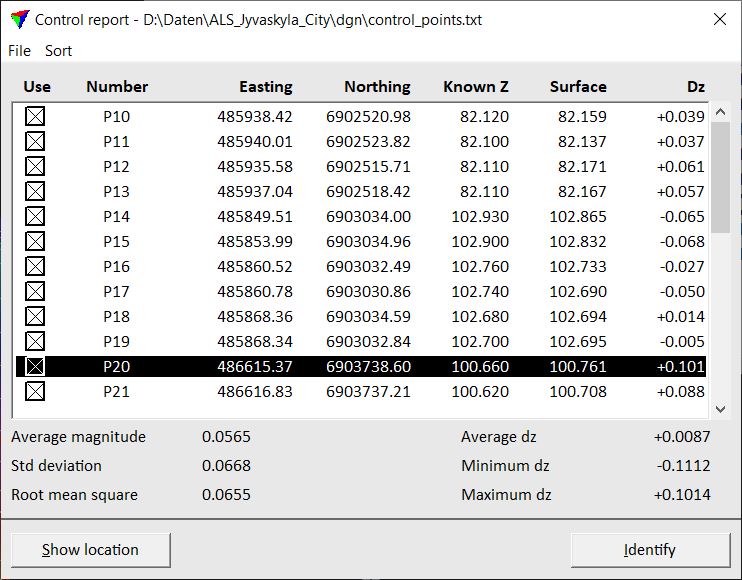
The report can be saved or printed directly by using the Save as text or Print command from the File pulldown menu. Outliers in Dz can be highlighted using the Settings command from the File menu. The command opens the Control report settings dialog where a limit for highlighting Dz values related to the standard deviation can be defined.
The report can be sorted by deviation, Dz, magnitude, number (identifier), easting or northing coordinates using the corresponding commands from the Sort pulldown menu.
The Use field in the report determines whether a control point is used in the report or not. You can exclude a control point from the report by clicking in the square of the respective control point.
The Show location button can be used to identify the location of a control point in a CAD file view. Click the button and move the mouse pointer into a view in order to show the control point location. A data click centers the view at the control point location.
The Identify button can be used to select a specific control point in the report. Click the button and move the mouse pointer inside a CAD file view. The control point closest to the mouse pointer is dynamically highlighted. A data click selects the control point in the report.
The Average dz value displayed on the lower right side of the report window can be used to apply a linear transformation to the surface model. The value indicates whether a surface is systematically too high or too low compared with the control points. Thus, transforming the elevation of the surface model using this value with inverse sign results in a better match between surface model and control points. You can use, for example, the Modify elevations command in the Surfaces window to apply the elevation correction to the surface model.