

TerraModeler User Guide
Compute Stockpile Volume
 Compute Stockpile Volume tool computes stockpile quantities and report volumes separately for stockpile regions. The calculation is based on a grid method. You can control the accuracy and speed of calculation by defining the grid size. The tool suits for reporting volume of stockpiles on smooth surfaces, as the reference surface cannot represent a rough, complex surface. Similar results applying more complex reference surface can be computed with Compute Quantity tool.
The surface for volume calculation can be defined by surface models loaded in TerraModeler or by points loaded in TerraScan.
In addition to the surface, this tool requires one or several stockpile region boundaries limiting stockpiles. A region boundary is used to bound volume computation and reporting, and to represent the reference surface.
To compute stockpile volumes:
1. Select polygon elements defining stockpile boundaries and (Optionally) region name text labels.
2. Select the Compute Stockpile Volume tool.
The Compute Stockpile Volume dialog opens:
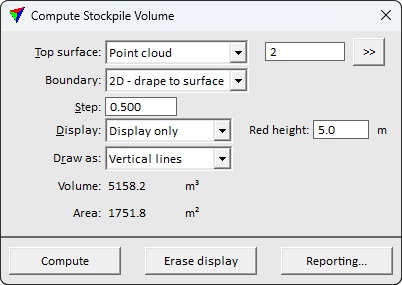
2. Define settings, and optionally Reporting options. Click Compute.
The Stockpile Volume Report dialog opens and the summary of computation results is displayed in the Compute Stockpile Volume dialog. If a Display option was selected, results are displayed graphically.
Setting |
Effect |
|---|---|
Top surface |
Name of the upper surface model for the quantity calculation. |
|
Opens the Select classes dialog which contains the list of active classes in TerraScan. You can select multiple source classes from the list that are then used in the Class field. Available only if Top surface is set to Point cloud. |
Boundary |
Method for defining the reference surface: •2D, drape to surface - stockpile boundaries only define the computation boundary. Reference surface is generated on the fly draping the boundary to the Top surface level. •3D, use directly - the polygons define both the computation boundary and the reference surface. The reference surface is triangulated directly from polygon vertices. Use only if polygon boundaries share the elevation system with the Top surface. |
Step |
Defines the grid size for the calculation. A small step produces more accurate results but the calculation process takes longer. |
Display |
Display method for presenting the calculation results graphically in the CAD file: •No display - nothing is drawn into the CAD file. •Draw temporarily - temporary display of vertical line elements. Disappears if the tool is deactivated or display cleared with Erase display. •Write to file - draws triangles as permanent elements into the CAD file on the active level. |
Red height |
Upper limit for the display color scale. Available only if Display is active. |
Draw as |
Elements used to present the results graphically: •Vertical lines - a vertical line is drawn at the center of each calculated grid cell. •Pilars - a 3D block is drawn for each calculated grid cell. Each block is build from 4 shape elements which may end up with a big number of elements to draw. Available only if Display is set to Write to file. |

The Stockpile reporting dialog provides an option to create text file reports storing variable - value pairs. These reports can be further used to form efficiently pre-formatted report documents filling calculated values.
To setup stockpile reporting:
1. Click on the Reporting button in the Compute Stockpile Volume dialog.
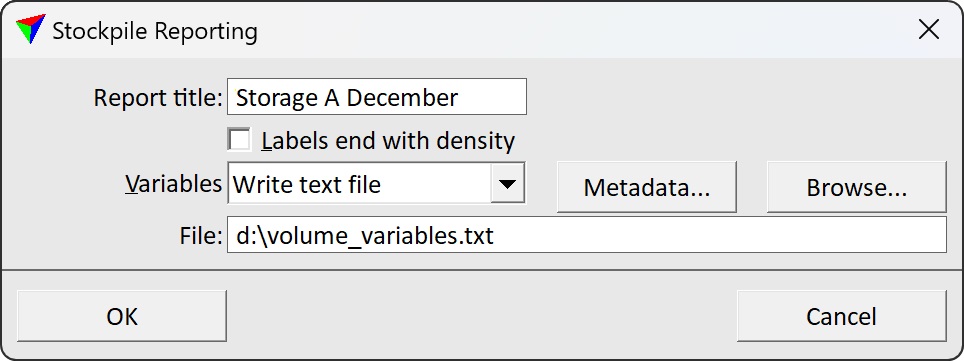
The Stockpile Reporting dialog opens:
2. Define settings according to your needs for the output report.
3. Click OK.
4. You can continue with Calculate in the Compute Stockpile Volume dialog.
If Variables is set to Write text file in the Quantity reporting dialog, the file storing variable - value pairs is created and saved at the given location on a hard disk.
Setting |
Effect |
|---|---|
Report title |
Free text that is used as title in the report. |
Labels end with density |
If on, a numeric value at the end of a text element inside a region is used as a multiplier to all volume values calculated for this region. |
Variables |
Determines if a variable text file is written and saved: •Do not write - no text file is written. •Write text file - a text file written and saved at the given File location. |
Metadata |
The button opens the Quantity Metadata dialog. The metadata is included at the beginning of the variable text file. |
File |
If on, region shapes without a text element inside are highlighted. |