

TerraModeler User Guide
Compute Quantity
 Compute Quantity tool computes quantities between two surfaces and produces results summing up both, cut and fill volumes. The calculation is based on a grid method. You can control the accuracy and speed of calculation by defining the grid size.
You can use a fence or a selected shape element to define the area for calculation. The computation area can be further limited by another surface.
The surfaces for volume calculation can be defined by surface models loaded in TerraModeler or by points loaded in TerraScan.
The tool provides several options for creating text reports of the quantity calculation results. The results are presented in a separate report windows from which a text file can be saved or the report can be printed directly. Besides a simple report for the overall calculation results, there is also the possibility to output See Quantity reports for subregions.
To compute quantities using the grid method:
1. Select the Compute Quantity tool.
The Compute Quantity dialog opens:
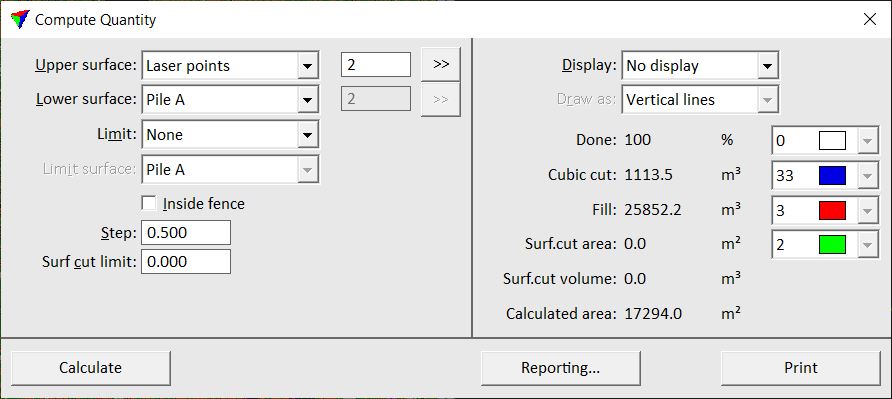
2. Define settings.
3. If a text report for subregions should be created, click on the Reporting button to define settings for the output. See See Quantity reports for subregions for more information.
4. Click on the Calculate button to start the computation.
The computation results are displayed on the right side of the Compute Quantity dialog, and possibly in the CAD file and a separate report window.
The results of the calculation for the whole area can be saved into a simple text report using the Print button in the Compute Quantity dialog.
The Erase display button appears if the results of the quantity computation have been displayed with setting Display only. Then, the button can be used to remove the temporary elements that illustrate the computation result. The temporary elements also disappear if the Compute Quantity dialog is closed.
Setting |
Effect |
|---|---|
Upper surface |
Name of the upper surface model for the quantity calculation. If Laser points is selected, the field for entering class number(s) becomes active. This requires that respective laser points are loaded in TerraScan. |
|
Opens the Select classes dialog which contains the list of active classes in TerraScan. You can select multiple source classes from the list that are then used in the class number field of the Upper surface. |
Lower surface |
Name of the lower surface model for the quantity calculation. If Laser points is selected, the field for entering class number(s) becomes active. Use the >> button in order to open the Select classes dialog for class selection. This requires that respective laser points are loaded in TerraScan. |
|
Opens the Select classes dialog which contains the list of active classes in TerraScan. You can select multiple source classes from the list that are then used in the class number field of the Lower surface. |
Limit |
Limiting surface to restrict the calculation area: •None - no limiting surface used. •Area - calculate only within the Limit surface area. •Lower limit - calculate only above Limit surface. •Upper limit - calculate only below Limit surface. |
Limit surface |
Surface to limit the calculation area. This is not active if Limit is set to None. |
Inside fence |
If on, the calculation takes place only inside a fence or a selected shape element. |
Step |
Defines the grid size for the calculation. A small step produces more accurate results but the calculation process takes longer. |
Surf cut limit |
The software computes the cut volume separately for places where the cut depth is less than this value. This may be used for billing purposes if the price is not based on the cut volume but on the cut area. |
Display |
Display method for presenting the calculation results graphically in the CAD file: •No display - nothing is drawn into the CAD file. •Display only - temporary display of vertical line elements. Disappears if the tool is deactivated. •Write to file - draws permanent elements on the active level. |
Draw as |
Elements used to present the results graphically: •Vertical lines - a vertical line is drawn at the center of each calculated grid cell. This is the only available option if Display is set to Display only. •Horizontal lines - a horizontal lines is drawn for each calculated grid cell row. •Filled shapes - a shape is drawn for each calculated grid cell row. •Pillars - a 3D block is drawn for each calculated grid cell. Each block is build from 4 shape elements which may end up with a big number of elements to draw. |
Color list next to calculation result line |
Defines the display color for drawing the results in the CAD file. Uses the active color table of the CAD file. |

Quantity reports for subregions
The Quantity reporting dialog provides an option to create output reports of quantity computations for subregions. In addition, a text file can be created that stores variable - value pairs.
Subregions and their names in the report can be defined in several ways:
•Coordinate blocks - the software divides the computation area automatically into squared blocks of a given size. The corner coordinates of the blocks are full meter coordinate values. The names for the subregions are automatically generated from the lower left corner coordinates of each block.
•Selected shapes - subregions are defined by selected shapes. This is useful for creating output values for distributed computation areas that are not adjacent to each other. The names for the subregions can be defined by text elements that is placed inside the shapes and selected together with the shapes. The software uses the selected text element whose origin point is inside a selected shape for naming the respective subregion in the report. In addition, if the text element ends with a numerical value, this can be used as a multiplier for the calculated quantities. This may be useful, for example, if a material has a certain density which effects the volume of this material. If no text element is used, the subregions are named automatically with "Region 1", "Region 2", etc.
•Elevation range - the computation is performed for a given elevation or depth range. A subregion is defined by a given elevation or depth value interval. The subregions are named automatically by the range values.
A report can include both, results for horizontal regions and for vertical ranges.
A variable text file can be created for horizontal regions only. The file saves a variable name and its value into a comma-separated text file. Each variable - value pair is written into a new line which starts with the # character. The file starts with the Metadata variables, followed by variables for each region, and finally the total values for the whole computation area.
The variable names for each region are a combination of the subregions name and the variable name separated by a underline character, for example, Region 1_CUT for the cut volume of a subregion, or Example1_FILL for the fill volume of a region named Example1 .
To setup quantity reports for subregions:
1. Click on the Reporting button in the Compute Quantity dialog.
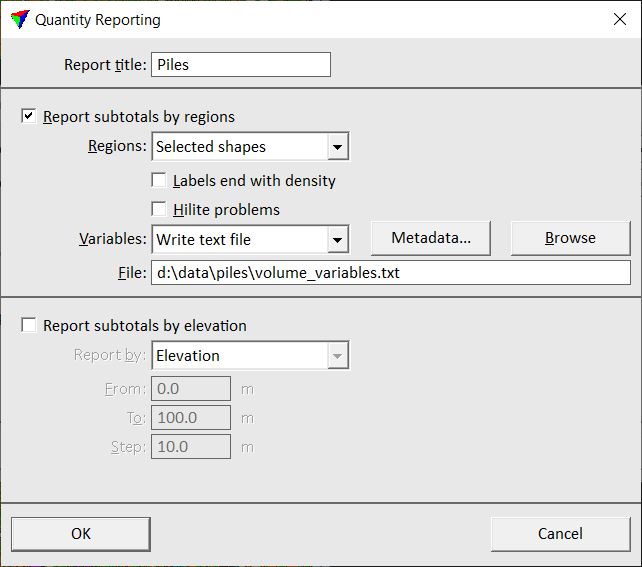
The Quantity reporting dialog opens:
2. Define settings according to your needs for the output report.
3. Click OK.
4. You can continue with Calculate in the Compute Quantity dialog.
If one of the options in the Quantity reporting dialog is switched on, an Output report window is displayed. Use the commands from the File pulldown menu in the report window to save the report as a text file or to print it directly.
If Variables is set to Write text file in the Quantity reporting dialog, the file storing variable - value pairs is created and saved at the given location on a hard disk.
Setting |
Effect |
|---|---|
Report title |
Free text that is used as title in the report. |
Report subtotals by regions |
If on, the quantity calculation results are reported for each region separately. |
Regions |
Method of how regions are defined: •Coordinate blocks - regions are defined by squared blocks with an edge length of the given Block size value. •Selected shapes - regions are defined by selected shape elements |
Labels end with density |
If on, a numeric value at the end of a text element inside a region is used as a multiplier to all volume values calculated for this region. This is only active if Regions is set to Selected shapes . |
Hilite problems |
If on, region shapes without a text element inside are highlighted. |
Variables |
Determines if a variable text file is written and saved: •Do not write - no text file is written. •Write text file - a text file written and saved at the given File location. |
Metadata |
The button opens the Quantity metadata dialog. The metadata is included at the beginning of the variable text file. |
Report subtotals by elevation |
If on, the quantity calculation results are reported for defined elevation or depth ranges. |
Report by |
Defines the type of range for the report: •Elevation - quantities are reported for defined elevation ranges. •Depth - quantities are reported for defined depth ranges. |
From |
Start value of the elevation/depth range for the report. |
To |
End value of the elevation/depth range for the report. |
Step |
Elevation or depth interval that defines the vertical size of the subregions. |
Order |
Defines what is stored in the rows and columns of the report: Regions as rows or Subtotals in rows. |