

TerraScan User Guide
View Tower Spans
 View Tower Spans tool makes it easy to traverse through a powerline and display tower and span locations in different types of views, such as top views, sections views, and profile views.
Additionally, top and oblique camera views of towers can be displayed showing aerial images. This requires that TerraPhoto is running and the availability of images organized in a TerraPhoto image list. Camera views might be useful in addition to other display options for towers and spans to support classification tasks or to identify tower structures.
The tool handles the automatic update of views as you scroll through a list of towers. The following view types can be automatically updated:
•Span top - a top view showing one tower span. The display is rotated into longitudinal direction of the powerline.
•Span profile - a section view showing a longitudinal profile along a tower span.
•Tower top - a top view showing the tower location. The top view is rotated to north direction pointing up.
•Tower rotated - a top view from the tower location. The view is rotated into longitudinal direction of the powerline.
•Tower section - a cross section view of the tower location.
•Tower tip - a cross section view of the tower tip.
•Tower profile - a longitudinal section view of the tower location.
•Camera top - a top-like camera view showing the tower location in an aerial image.
•Camera oblique 1 - an oblique camera view looking in backward direction from the tower location along the powerline.
•Camera oblique 2 - an oblique camera view looking in forward direction from the tower location along the powerline.
The tool is useful for various processing steps, for example:
•for manually classifying laser points very close to wires or towers, such as noise points.
•for validating the automatically detected wires.
•for classifying points on towers.
•for placing tower models.
To view tower spans:
1. Activate a tower string element using the Activate Powerline tool.
2. Select the View Tower Spans tool.
This opens the View Tower Spans dialog:
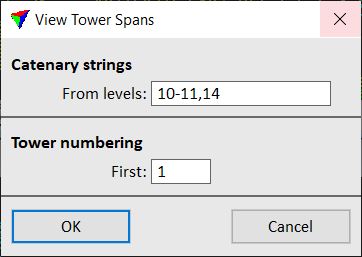
3. Type the number(s) of CAD file level(s) that contain catenary string elements into the From levels field.
4. Type a number for the first tower. The numbering is only applied to the list of towers displayed by this tool.
5. Click OK.
This opens the Tower Span Display dialog:
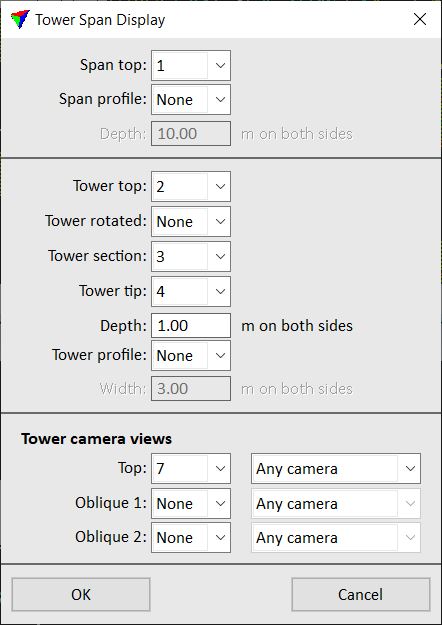
6. Select views that are used for the different display options.
A Depth value determines the depth of a section in section/profile views. It also defines the area of data within which points are classified using Above curve or Below curve commands.
A Width value determines the width of a tower profile view in longitudinal direction left and right of the tower location.
Select None if you do not want to use a display option in any view.
7. Click OK.
This activates the Tower Spans dialog:
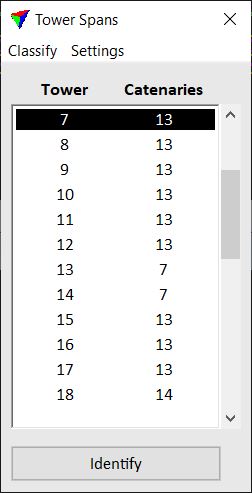
The dialog contains a list of all tower locations that are represented by vertices of the active tower string. For each tower, the number of catenaries starting from this tower is shown.
8. Open the CAD file views that you want to use to display data. Arrange the views on the screen.
9. Select a line in the list of towers.
This updates the display in the open views according to the view setup.
You can change the view setup by using the Display command from the Settings pulldown menu. This opens the Tower Span Display dialog described above.
The commands from the Classify pulldown menu can be used to classify points in section views.
Above curve command classifies points above a given curve and within the section view depth. The curve is defined by three manually placed data points.
To classify points above a curve:
1. Select Above curve command from the Classify pulldown menu.
This opens the Classify above curve dialog:
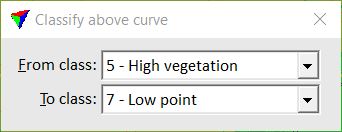
2. Select a point class in the From class field from which to classify points.
3. Select a point class in the To class field into which to classify points.
4. Define the first, second, and third point of the curve with data clicks in a section view. The points are displayed temporarily as small white points and the curve is shown as a temporary drawing after the second point has been placed.
You can undo the placement of the points step-by-step with reset clicks.
After the third point is placed, the points above the curve and within the depth of the section are classified.
You can undo the classification by using the Undo or From list commands of TerraScan.
Below curve command classifies points below a given curve and within the section view depth. The curve is defined by three manually placed data points.
To classify points below a curve:
1. Select Below curve command from the Classify pulldown menu.
This opens the Classify below curve dialog:
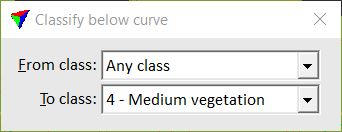
2. Select a point class in the From class field from which to classify points.
3. Select a point class in the To class field into which to classify points.
4. Define the first, second, and third point of the curve with data clicks in a section view. The points are displayed temporarily as small white points and the curve is shown as a temporary drawing after the second point has been placed.
You can undo the placement of the points step-by-step with reset clicks.
After the third point is placed, the points below the curve and within the depth of the section are classified.
You can undo the classification by using the Undo or From list commands of TerraScan.