

TerraModeler User Guide
Display Grid
 Display Grid tool generates a grid presentation of a surface model. You can create a coloring scheme where the color of the grid squares changes according to the surface elevation.
To display a grid:
1. Select the Display Grid tool.
The Display Grid dialog opens:
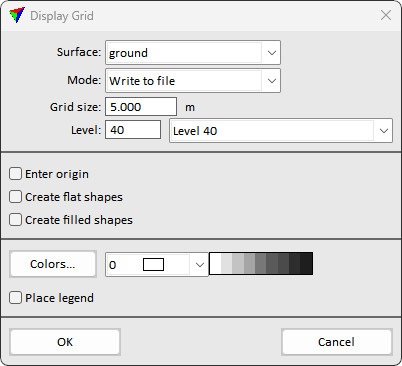
2. Define settings and click OK.
3. If Enter origin is switched on, define the origin point of the grid with a data click.
This draws a squared grid for the selected surface model on the given level.
4. If Place legend is switched on, define the location of drawing the legend with another data click.
Setting |
Effect |
|---|---|
Surface |
Name of the effected surface model. |
Mode |
Display mode for the grid: •Write to file - elements are written and stored in the CAD file. |
Grid size |
Size of rectangular squares in the grid. |
Level |
Number of the level in the CAD file on which the grid is drawn. |
Enter origin |
If on, you can enter the origin point of the grid with another data point. If this point is inside the surface area, it becomes a corner point of the grid square at this location. |
Create flat shapes |
If on, each grid square is drawn as flat square at the elevation of its center point. |
Create filled shapes |
If on the grid squares are filled with color. |
Colors |
Opens the Color scheme dialog. See Creating a color scheme of discrete colors for more information. |
Color list left of the color scheme preview |
Opens the CAD file color table for single color selection. |
Place legend |
If on, a legend for the triangle colors can be placed in the CAD file. This is only active if a color scheme is defined. |