

TerraScan User Guide
View Waveform
Not Lite, Not UAV
 View Waveform tool opens the Waveform dialog that displays the waveform shape of single laser points. The dialog contains commands for identifying a point, showing a point’s location, drawing the waveform vector into the CAD file, saving the waveform as text file, and changing the display settings of the waveform graph.
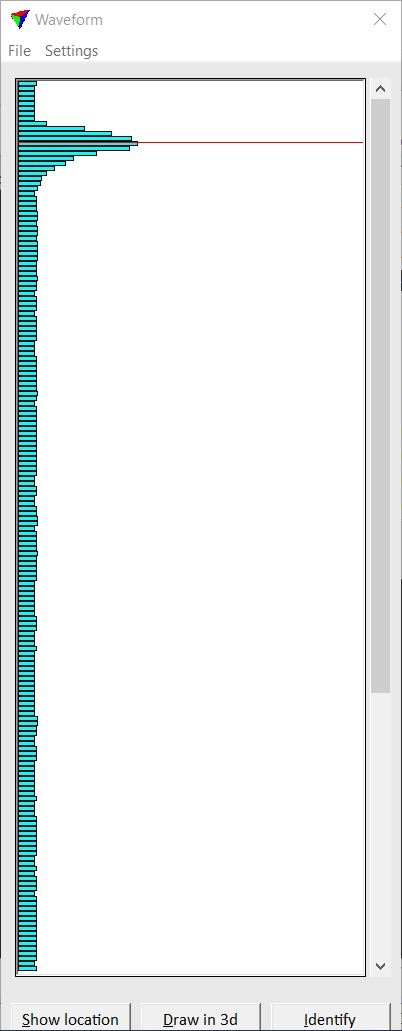 The waveform graph represents the waveform of a return signal by bars of constant height and varying length. The height of a bar corresponds to a 30 centimeters distance of light travel. The length of a bar indicates how many photons returned to the scanner from an object. Short bars of approximately the same length (= small waveform sample values) represent the background noise, longer bars more or less strong returns from objects. A red line in the graph indicates the location of the selected laser point.
Viewing the waveform requires that trajectories are active and laser points are loaded in TerraScan. The points must be linked to the trajectories and the trajectories must reference the waveform files. See Waveform processing principles and Workflow summary for more information.
To view the waveform of a laser point:
1. Select View Waveform tool.
The Waveform dialog opens.
2. Click on the Identify button of the dialog.
3. Define a laser point with a data click inside a view.
This displays the waveform graph for the laser point closest to the data click.
Click on the Show location button and move the mouse pointer inside a CAD file view in order to highlight the point for which the waveform is show. A data click inside a view centers the highlighted point in the view.
To draw the waveform vector into the CAD file:
1. Identify a laser point for waveform graph display.
2. (Optional) Center the point in a cross section view. This may be best for viewing the waveform vector.
3. Click on the Draw in 3d button.
This draws the waveform vector into the CAD file. The vector is represented by a cell element that contains lines of different colors. Red color is used for the strongest return, yellow, green, cyan, blue for other returns of decreasing strength, and gray for background noise.
To save the waveform of a point into a text file:
1. Identify a laser point for waveform graph display.
2. Select Save As text command from the File pulldown menu.
This opens the Save waveform as text dialog, a standard dialog for saving files.
3. Define a location and file name for saving the text file and click Save.
This saves the text file.
To save the waveform of multiple points into a text files:
1. Draw a fence or polygon around the points for which you want to export the waveform. Select the polygon.
2. Select Save inside fence command from the File pulldown menu.
This opens the Browse For Folder dialog, a standard dialog for selecting a storage folder.
3. Select a folder for saving the text files and click OK.
This saves a text file for each point inside the fence/selected polygon. An information dialog shows the number of saved text files out of the number of points. The text files are named automatically as WAVEFORM_<timestamp>_<echo type>.TXT.
To change the settings for waveform display:
1. Select Display settings command from the Settings pulldown menu.
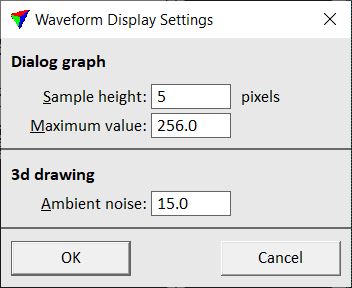
This opens the Waveform Display Settings dialog:
2. Define settings and click OK.
This applies the new settings for the display.
SETTING |
EFFECT |
|---|---|
Sample height |
Height of a bar in the waveform graph. Given in screen pixels. |
Maximum value |
Defines the maximum length of a bar that can be displayed in the graph. The value effects the scale of the length of the bars. |
Ambient noise |
Limit value for background noise. If a waveform sample value is smaller than or equal to the given value, a 3d vector line is drawn in gray. |