

TerraScan User Guide
Check coverage
Not UAV
Check coverage command finds holes and areas of low point density in the project binary files. The area to be covered can be either defined by one or more selected polygons or by all block boundaries of the project. The application calculates the point density within sample areas and decides to which coverage level an area belongs.
The point coverage is defined in four levels: Covered, Almost covered, Almost hole and Hole. User settings define the point densities which are interpreted as being holes or as being fully covered. The command can create different output products in order to illustrate the point coverage. The options include:
•the creation of a density raster image showing the point coverage in a TIFF file. The raster images get the same name as the original block binary files.
•the creation of points in a uniform grid structure that fill the holes and areas of low point density. Three different classes can be used to separate the points according the coverage level. The elevation of the artificial points is set to be equal to the number of points found in the sampling area. The points are saved in TerraScan binary files which get the same name as the original block binary files. A project file with the name DENSITY.PRJ is created that references the binary files with the artificial point.
•the output of the density calculation results in a report window. You can save a text file from the report window.
To check the laser point coverage in a project area:
1. (Optional) Draw and select one or more polygons around areas for which you want to check the coverage.
2. Select Check coverage command from the Tools pulldown menu.
3. If no polygons are selected, the application informs you that it uses all block boundaries for the check. Click OK.
This opens the Check Coverage dialog:
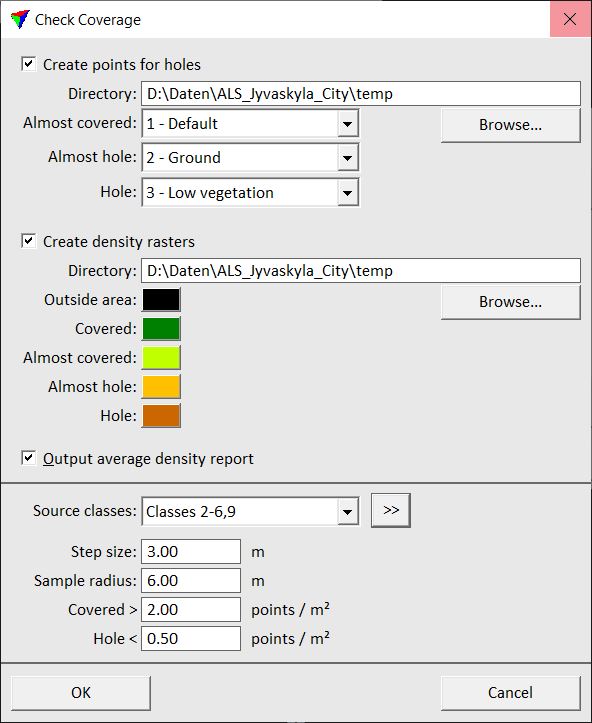
4. Define settings and click OK.
This starts the calculation of the point densities and the coverage. The software creates the files according to the settings in the given directories. An information window shows the progress of the process.
SETTING |
EFFECT |
|---|---|
Create points for holes |
If on, points are created that fill holes, almost hole and almost covered areas. |
Directory |
Directory for storing the TerraScan binary files and the project file for the artificial points. This is active only if Create points for holes is switched on. |
Almost covered |
Class for artificial points in almost covered areas. This is active only if Create points for holes is switched on. |
Almost hole |
Class for artificial points in almost hole areas. This is active only if Create points for holes is switched on. |
Hole |
Class for artificial points in holes. This is active only if Create points for holes is switched on. |
Create density raster |
If on, density raster images in TIFF format are created. |
Directory |
Directory for storing the density raster images. This is active only if Create density raster is switched on. |
Outside area |
Color in density raster images for areas outside the covered area. This is active only if Create density raster is switched on. |
Covered |
Color in density raster images for covered areas. This is active only if Create density raster is switched on. |
Almost covered |
Color in density raster images for almost covered areas. This is active only if Create density raster is switched on. |
Almost hole |
Color in density raster images for almost hole areas. This is active only if Create density raster is switched on. |
Hole |
Color in density raster images for holes. This is active only if Create density raster is switched on. |
Output average density report |
If on, a report window is displayed showing the amount of points per measurement area and the point density. |
Source classes |
Point class(es) that are included in the coverage calculation. |
|
Opens the Select classes dialog which contains the list of active classes in TerraScan. You can select multiple source classes from the list that are then used in the Source classes field. |
Step size |
Defines the steps at which the point density is analyzed. Determines also the pixel size of the density raster images and the distance between the artificial points that are created to fill holes and areas of low density. |
Sample radius |
Radius of the sample area from which to calculate the local point density. |
Covered > |
Point density required for an area being considered as covered. |
Hole < |
Point density for an area that will be considered as hole. |

Since the file names of the files created by the process are fixed, existing files are overwritten without warning if the command is performed a second time on a project with the same directory settings.