

TerraModeler User Guide
Compute Alignment Quantity
Not Lite
 Compute Alignment Quantity tool computes quantities along an alignment element. The tool uses the grid method for computing quantities between two surfaces.
The alignment can be defined by a linear element, such as a 3D line string or complex chain. The area of calculation is limited by the extension of the alignment element. It may be further limited by another surface model.
The surfaces can be defined by surface models in TerraModeler or by points loaded in TerraScan.
The results of the computation are shown in the tool’s dialog. They can be presented graphically in the CAD file and a text report can be stored as well.
To compute quantities along an alignment:
1. Select an alignment element.
2. Select the Compute Alignment Quantity tool.
The Compute Alignment Quantities dialog opens:
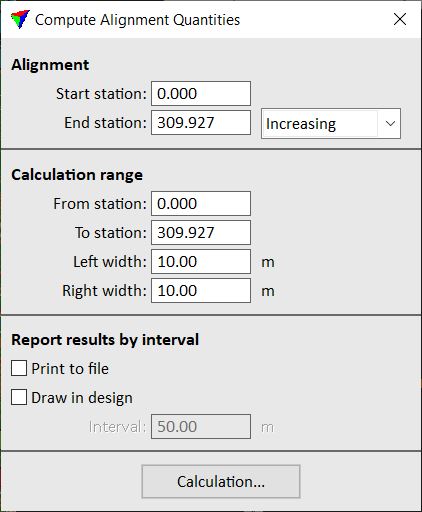
3. Define settings for the computation related to the alignment element.
Setting |
Effect |
|---|---|
Start station |
Station value at the start point of the alignment element. |
End station |
End station value defined by the length of the alignment element: •Increasing - station values are increasing from start to end station. •Decreasing - station values are decreasing from start to end station. |
From station |
Start station value for the quantity computation. |
To station |
End station value for the quantity computation. |
Left width |
Defines the computation area boundary parallel to the left from the alignment. |
Right width |
Defines the computation area boundary parallel to the right from the alignment. |
Print to file |
If on, the results of the computation are saved into a simple text file. |
Draw into design |
If on, the boundaries of the computation area and a linear scale of the alignment are drawn into the CAD file. The scale is divided into sections of the length defined by the Interval value. For each section, the rounded calculated quantity value is displayed. |
4. Click on the Calculation button.
This opens another Compute Alignment Quantities dialog:
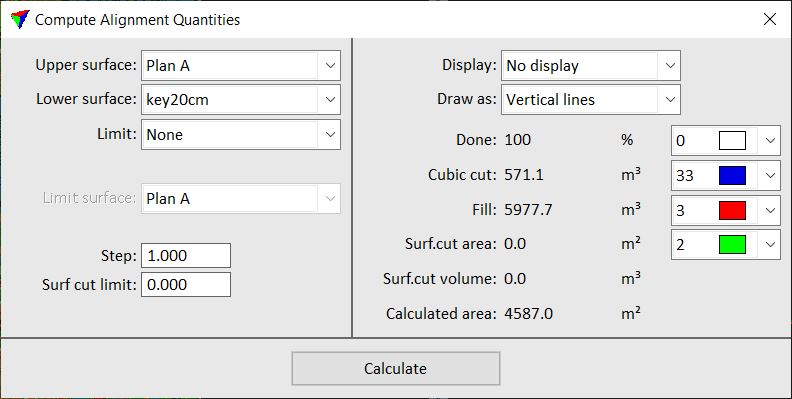
5. Define settings related to surface models, computation steps, and display of the results.
6. Click on the Calculate button.
The computation of the quantities starts. The results are displayed in the Compute alignment dialog on the right side and possibly in the CAD file. If Print to file was selected in the first dialog, a standard Windows dialog opens to define the location for storing the text file on a hard disk.
Setting |
Effect |
|---|---|
Upper surface |
Name of the upper surface model for quantity calculation. The use of Laser points requires that the points which define the surface are loaded into TerraScan. |
Lower surface |
Name of the lower surface for quantity calculation. The use of Laser points requires that the points which define the surface are loaded into TerraScan. |
Limit |
Limiting surface to restrict the calculation area: •None - no limiting surface used. •Area - calculate only within the Limit surface area. •Lower limit - calculate only above Limit surface. •Upper limit - calculate only below Limit surface. |
Limit surface |
Surface to limit the calculation area. This is not active if Limit is set to None. |
Step |
Defines the grid size for the calculation. A small step produces more accurate results but the calculation process takes longer. |
Surf cut limit |
The software computes the cut volume separately for places where the cut depth is less than this value. This may be used for billing purposes if the price is not based on the cut volume but on the cut area. |
Display |
Display method for presenting the calculation results graphically in the CAD file: •No display - nothing is drawn into the CAD file. •Display only - draws temporary elements. •Write to file - draws permanent elements into the CAD file on the active level. |
Draw as |
Elements used to present the results graphically: •Vertical lines - a vertical line is drawn at the center of each calculated grid cell. This is the only available option if Display is set to Display only. •Horizontal lines - a horizontal lines is drawn for each calculated grid cell row. •Filled shapes - a shape is drawn for each calculated grid cell row. •Pillars - a 3D block is drawn for each calculated grid cell. Each block is build from 4 shape elements which may end up with a big number of elements to draw. |
Color list next to calculation result line |
Defines the display color for drawing the results in the CAD file. Uses the active color table of the CAD file. |
TerraModeler has two tools for computing quantities along an alignment. Compute Alignment Quantity tool calculates volumes using the grid method and requires that you have an existing surface model for the excavation/accumulation. Compute Section Quantity tool uses section templates to define the excavation/accumulation and calculates volumes using the end-area method.