

TerraMatch User Guide
Find Rubbersheet Fit
 Find Rubbersheet fit tool can be used to match data to control points. The matching is done based on a triangulated correction model for XYZ, XY, or Z.
The tool requires tie lines that are suitable for computing the correction model. The tie lines are collected using commands from the TerraMatch Tie line window. Suitable tie line types are Known xyz, Known xy, or Known z.
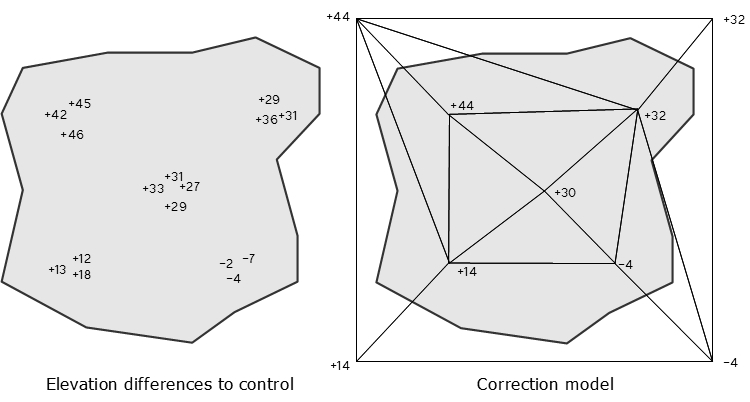
In the tool settings you can define how averaging is applied between closeby observations. Further, the values for the outer corners of the correction model can be either derived from the closest correction value or set to zero. The following figure illustrates the computation of a rubbersheet correction model.
The tool can be used, for example, as a last adjustment step for aerial airborne laser data. After matching the data internally, the data set is matched to control points using the rubbersheet correction.
General procedure for finding and applying fluctuating corrections:
1. Select Find Rubbersheet Fit tool.
This opens the Find Rubbersheet Fit dialog:
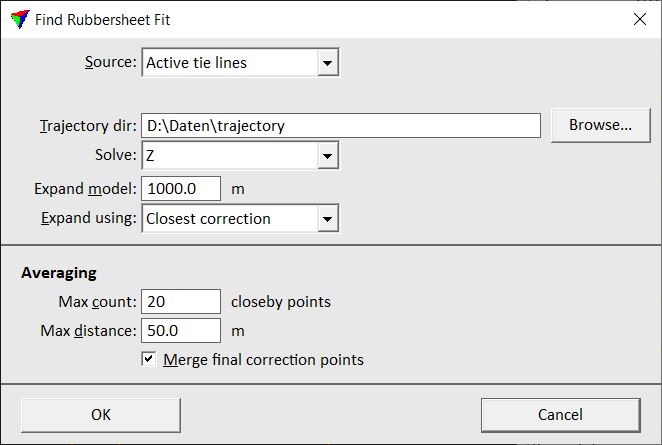
2. Define settings and click OK.
Setting |
Effect |
|---|---|
Source |
Source file for calculating the fluctuating corrections: •Active tie lines - tie lines in an open Tie line window are used. •Tie line file - tie lines stored in a tie line file are used. |
Tie lines |
Path to the tie line file that is used for calculating the corrections. This is only active when Source is set to Tie line file. |
Trajectory dir |
Directory where the TerraScan trajectory files are stored. |
Solve |
Defines what correction values are computed: Xyz, Xy, or Z. |
Expand model |
Distance by which the correction model is expanded from the observation location closest to the data set boundary to the outside. |
Expand using |
Determines how the values for the outside corners of the correction model are derived: •Zero correction - the correction value is set to 0.0. •Closest correction - the correction value is equal to the closest computed correction value. |
Max count |
Maximum amount of observations that are averaged if they are located closeby. |
Max distance |
Maximum distance between observations that are averaged. |
Merge final correction points |
If on, the final correction points are merged into one correction value according to the averaging settings. |
This opens the Find Rubbersheet Correction Results dialog:
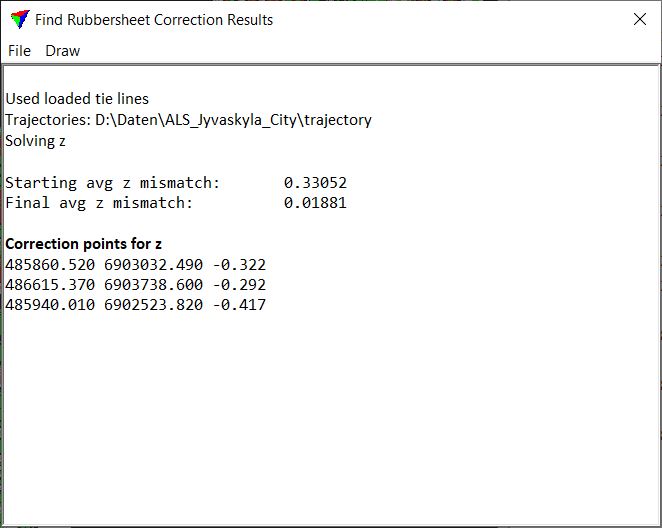
The dialog shows the report of the correction model computation. Starting and final average mismatch values indicate the level of improvement that can be achieved by applying the correction model. Further, list of all correction points of the model is shown.
3. (Optional) You may draw the correction vectors into the CAD file by using the command from the Draw pulldown menu. The commands open the Draw Correction Vectors dialog which lets you define a scale factor for drawing the correction vectors.
4. Save a corrections file using the Save corrections command from the File pulldown menu.
You may also save the report as a text file or print it directly by using the corresponding commands from the File pulldown menu.
5. Apply the corrections to the laser data using the Apply Correction tool.