

TerraPhoto User Guide
Output report
Output report command creates a report based on the active tie points. You may use this command to accomplish the following:
•Find out how many images have enough tie points and how many do not.
•Find tie points or images with large mismatch distances.
•Find and apply the best misalignment angles for camera(s).
•Find out how well known tie points match to known control point coordinates.
To output a tie point report:
1. Select Output report command from the File pulldown menu.
This opens the Tie Point Report dialog:
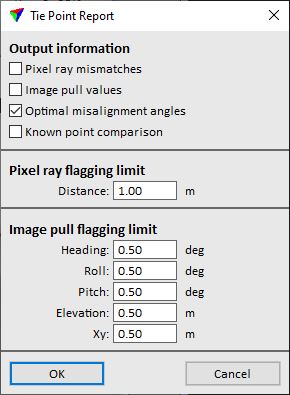
2. Define settings and click OK.
This computes the report values and opens the Tie point report.
SETTING |
EFFECT |
|---|---|
Pixel ray mismatches |
If on, the report contains mismatch distances for each tie point pixel. |
Image pull values |
If on, the report contains the pull direction for each image translated into heading, roll, and pitch changes. |
Optimal misalignment angles |
If on, the report includes camera misalignment values which produce the smallest tie point mismatches using raw image positions. |
Known point comparison |
If on, the report includes a comparison of how well pixel rays of known tie points match the known point coordinates. |
Distance |
Writes pixel ray mismatch in red if it exceeds this value. |
Heading |
Writes heading pull value in red if it exceeds this value. |
Roll |
Writes roll pull value in red if it exceeds this value. |
Pitch |
Writes pitch pull value in red if it exceeds this value. |
Elevation |
Writes elevation pull value in red if it exceeds this value. |
Xy |
Writes xy pull value in red if it exceeds this value. |
The tie point report is displayed in the Tie point report window. The window contains pulldown menus and the report information:
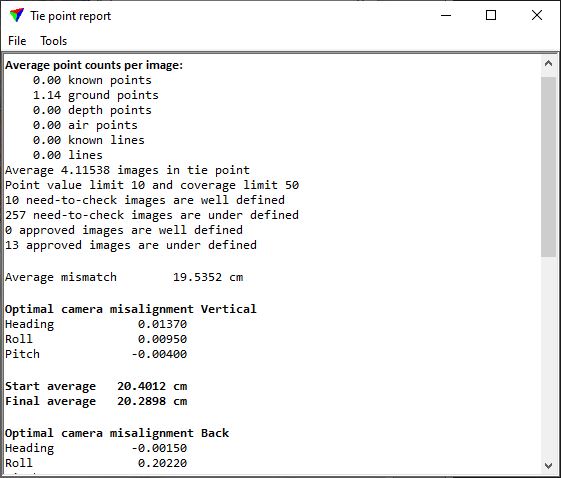
Use commands from the File pulldown menu to save the report as a text file and to print the report directly.
Apply misalignment command from the Tools pulldown menu applies the optimal camera misalignment values to the camera calibration file(s) for each camera of the mission. Further, the command automatically saves the camera calibration file(s) and recomputes the tie points. This should be done if the Final average value in the report is smaller than the Start average value, which means that the optimal camera misalignment values improve the image positioning.
Depending on the selected settings in the Tie point report dialog, the report includes the following information:
•Average point counts per image lists the average number of tie points per image for each tie point type. Further, it displays the number of images with tie status Check that are well-defined and under-defined according to the given tie point value and coverage limits. The same is shown for images with tie status Approved.
•Pixel ray mismatches shows a list of all tie points, their geographical coordinates, and the mismatch distances in centimeters of each tie point pixel. The tie points are sorted by tie point type. The list ends with the average mismatch distance.
•Image pull values are reported in a table which lists all images. For each image the number of tie points per type and changes in values for heading, roll, pitch, elevation, and xy are displayed. The table ends with the average change for each value.
•Optimal camera misalignment provides the optimal misalignment angles for each camera of the mission. Start average and Final average values allow the comparison between the average mismatch with the current camera misalignment angles and with the optimal camera misalignment angles. If the value for Final average is smaller than the value for Start average, the new misalignment angles should be applied to the camera calibration files.
•Known point comparison lists all known points, their geographical coordinates, and the mismatch distances for x,y, and z (if available) between the known points and the Known tie points/lines. The table ends with the average values for the mismatch distances. Further, the report gives a recommendation for a linear transformation in xyz. It shows values that should be added to easting, northing, and elevation of the image coordinates in order to match the images better to the known points. These values can be used to Transform positions of the image list and thus, improve the absolute accuracy of the image list. If group numbers are assigned to images, the report also provides an xyz shift recommendation for each group. Finally, the Average and Worst mismatch distances between known points and Known tie points/lines are shown.