

TerraPhoto User Guide
Color corrections
There are six values which can be modified in order to correct coloring issues in the raw images: red, green, blue color channels, intensity, saturation, and contrast.
General process to apply color corrections:
1. Select one or more image thumbnails for which you want to apply color corrections.
2. Fill in values you want to change.
3. Click on the Apply button next to each setting to see the affect in the thumbnail display and to write color correction values to the image list.
4. Continue until all color corrections are applied.
5. Save the image list using Save list or Save list As commands from the Images pulldown menu in the TPhoto window in order to save the color corrections into an image list file.
You can check the result of color corrections by choosing Define color points command from Rectify pulldown menu in TPhoto window. This creates a preview of the ortho mosaic using the color corrections on-the-fly. Use Update view tool for CAD file views in order to apply changes to the preview.
Color balance
Red, Green and Blue add the given correction values to the red, green, and blue channels of an image. The values may range between -255 (no red/green/blue) and +255 (full red/green/blue).
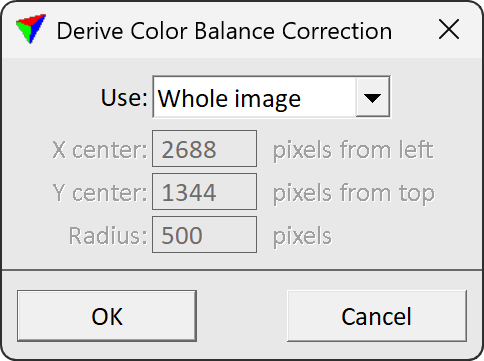
Correction values for the color balance can be derived automatically. The Derive button next to the RGB fields opens the Derive Color Balance Correction dialog:
SETTING |
EFFECT |
|---|---|
Use |
Image area used for deriving the color balance correction: •Whole image - the whole image area is used. •Circular area - a circular area starting from a given center point is used. |
X center |
X coordinate of the image pixel that defines the center point of a circular correction area. Given in pixels from the left image edge. This is only active if Use is set to Circular area. |
Y center |
Y coordinate of the image pixel that defines the center point of a circular correction area. Given in pixels from the top image edge. This is only active if Use is set to Circular area. |
Radius |
Defines the size of the circular correction area in pixels. This is only active if Use is set to Circular area. |
If several images are selected, the color balance correction is derived individually for each image. The method is useful for down-looking mobile images that mostly see the gray road surface.
The Sample button next to the RGB fields can be used to derive correction values for the color channels automatically. The software computes correction values for the color channels that result in gray coloring at the location selected by the mouse pointer. This is especially useful if there is a color cast in images. Then, the tool should be used in a part of the image that should be gray but clearly shows the color cast (e.g. a gray road surface looking greenish).
To derive color corrections for gray balance adjustment:
1. Activate the Sample button next to the RGB fields with a data click on the button.
2. Place data clicks in thumbnails at several locations where there are gray objects/surfaces.
This displays correction values next to the RGB fields.
3. Continue until you get an impression of good correction values that result in a balanced gray coloring for a number of images.
4. Deactivate the Sample button with a data click on the button.
5. Select the images for which to apply color corrections.
6. Type the correction values in the Red, Green, and Blue fields and click Apply.
This applies the color corrections to the selected images. Gray objects/surfaces should now appear with gray coloring.
Intensity
Intensity multiplies the given value with the Value in the HSV color model. It is expressed as percentage and makes the image brighter or darker. A setting of +40 multiplies the Value with 1.40, a setting of -25 with 0.75. The possible values range from -100 to +500.
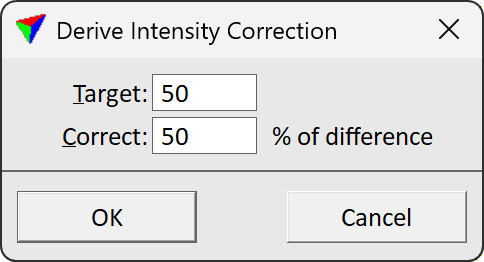
 Correction values for intensity can be derived automatically. The .. button next to the intensity field opens the Derive intensity correction dialog:
SETTING |
EFFECT |
|---|---|
Target |
Target intensity value to move images towards. This is expressed as a number ranging from 0 to 100. |
Correct |
Percentage of difference to correct. For example, if an image has an intensity value of 36, Target is set to 60 and Correct to 50, the image would end up with intensity 48. |
If several images are selected, the intensity correction is derived individually for each image.
Intensity Grid Correction
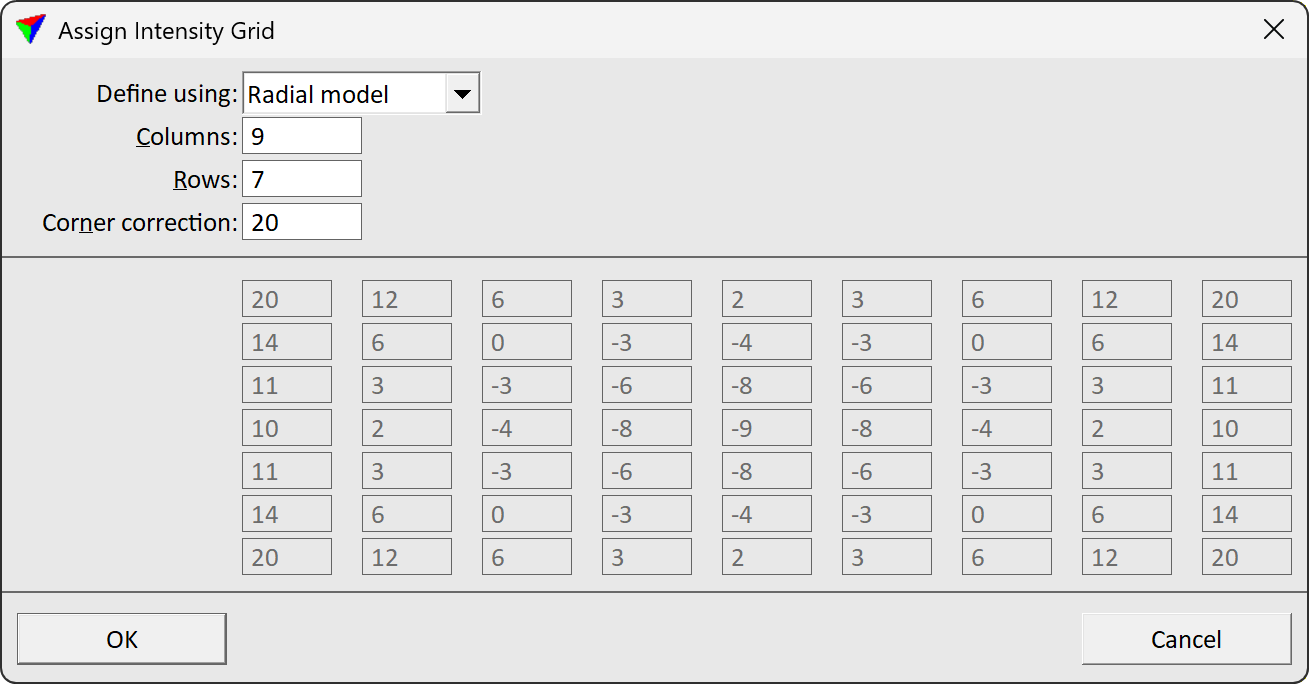
In addition to the unique intensity correction for an image, a grid-based correction can be applied as well. Then, local correction values are distributed over an image in a grid structure. The distribution of the correction values is defined in the Assign Intensity Grid dialog which opens from the Intensity grid button:
SETTING |
EFFECT |
|---|---|
Define using |
Method for deriving the correction grid: •Radial model - only the maximum intensity correction for image corners is given, other correction values are derived automatically. •Manual entry - all correction values of the grid can be defined manually. |
Columns |
Number of columns in the correction value grid. Numbers can range from 3 to 9. |
Rows |
Number of rows in the correction value grid. Numbers can range from 3 to 9. |
Corner correction |
Maximum correction value applied to the image corners. Expressed as percentage value. If the corner correction is positive, the corners of the image(s) become brighter while the center becomes darker. If the corner correction is negative, the corners become darker and the center becomes brighter. All correction values average to zero. This is only active if Define using is set to Radial model. |
<input fields for manual entry> |
Fields for typing correction values manually. A positive value makes intensity brighter, a negative value darker. The amount of fields depend on the given number of Columns and Rows. To get starting values for the manual entry, type a Corner correction value when Define using is set to Radial model. This shows the corresponding correction values in the input fields. The fields are only active if Define using is set to Manual entry. |
Saturation and Contrast
Saturation multiplies the given value with the Saturation in the HSV color model. It is expressed as percentage and makes the colors of the image stronger or weaker. A setting of +40 multiplies the Saturation with 1.40, a setting of -25 with 0.75. The possible values range from -100 to +200. The minimum value -100 multiplies with 0.00 and results in a gray scale image.
Contrast moves the RGB values away from the center value, which means that the histogram for each channel is stretched from the center value 128 (positive values) or tightened towards the center value 128 (negative values). The possible values range from -100 to +200.
The histogram display on the left side of the Define color correction dialog gives an indication, how the changes effect the color value distribution for each color channel. The gray graphs show the original color distribution while the red, green or blue graphs display the distribution with the current settings.