

TerraScan User Guide
Survey / Draw curvature graph
Draw curvature graph command can be used to display the curvature information of a filtered line string and the geometry components in a graph.
To draw a curvature graph:
1. Select a line string element using the CAD Selection tool.
2. Select Draw curvature graph command from the Survey pulldown menu.
This opens the Draw curvature graph dialog:
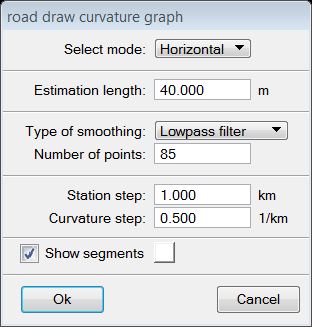
3. Define settings and click OK.
4. Define the location of the graph drawing with a data click in a CAD view.
This draws the graph as cell element into the CAD file. The graph is drawn on the active level.
SETTING |
EFFECT |
|---|---|
Select mode |
Defines for which geometry the graph is drawn: Horizontal or Vertical. |
Estimation length |
Specifies the length of a line string segment used for estimating the curvature. Higher values reduce the oscillations in curvature values. |
Type of smoothing |
Determines the smoothing mode: None, Moving average, Moving median, or Lowpass filter. |
Number of points |
Number of points used for smoothing. |
Station step |
Determines the horizontal scale markings in the graph. |
Curvature step |
Determines the vertical scale markings in the graph. |
Show segments |
If on, components of an existing geometry are drawn in the graph using the selected color. |
The application uses the same graph drawing if the command is performed for a second time during the same work session. The connection gets lost if the Component fitting main window is closed.